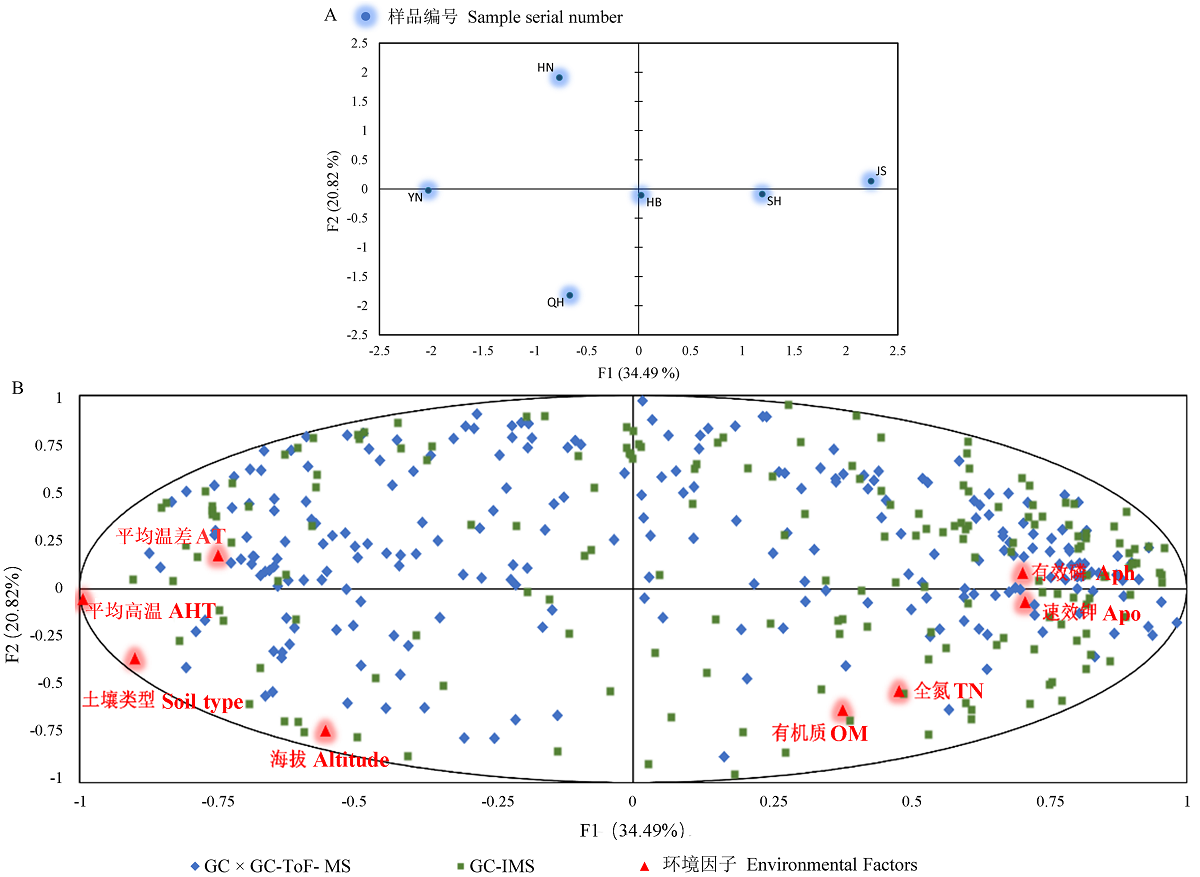
Fig. 8 Multi-factor analysis plot of volatile compounds and environmental factors A: MFA analysis of each sample group; B: MFA analysis of volatiles identified by GC×GC-ToF-MS and GC-IMS and environmental factorsAT: Average temperature difference; AHT: Average high temperature; Aph: Available phosphorus; Apo: Available potassium; TN: Total nitrogen; OM: Organic matter
Other figure/table from this article