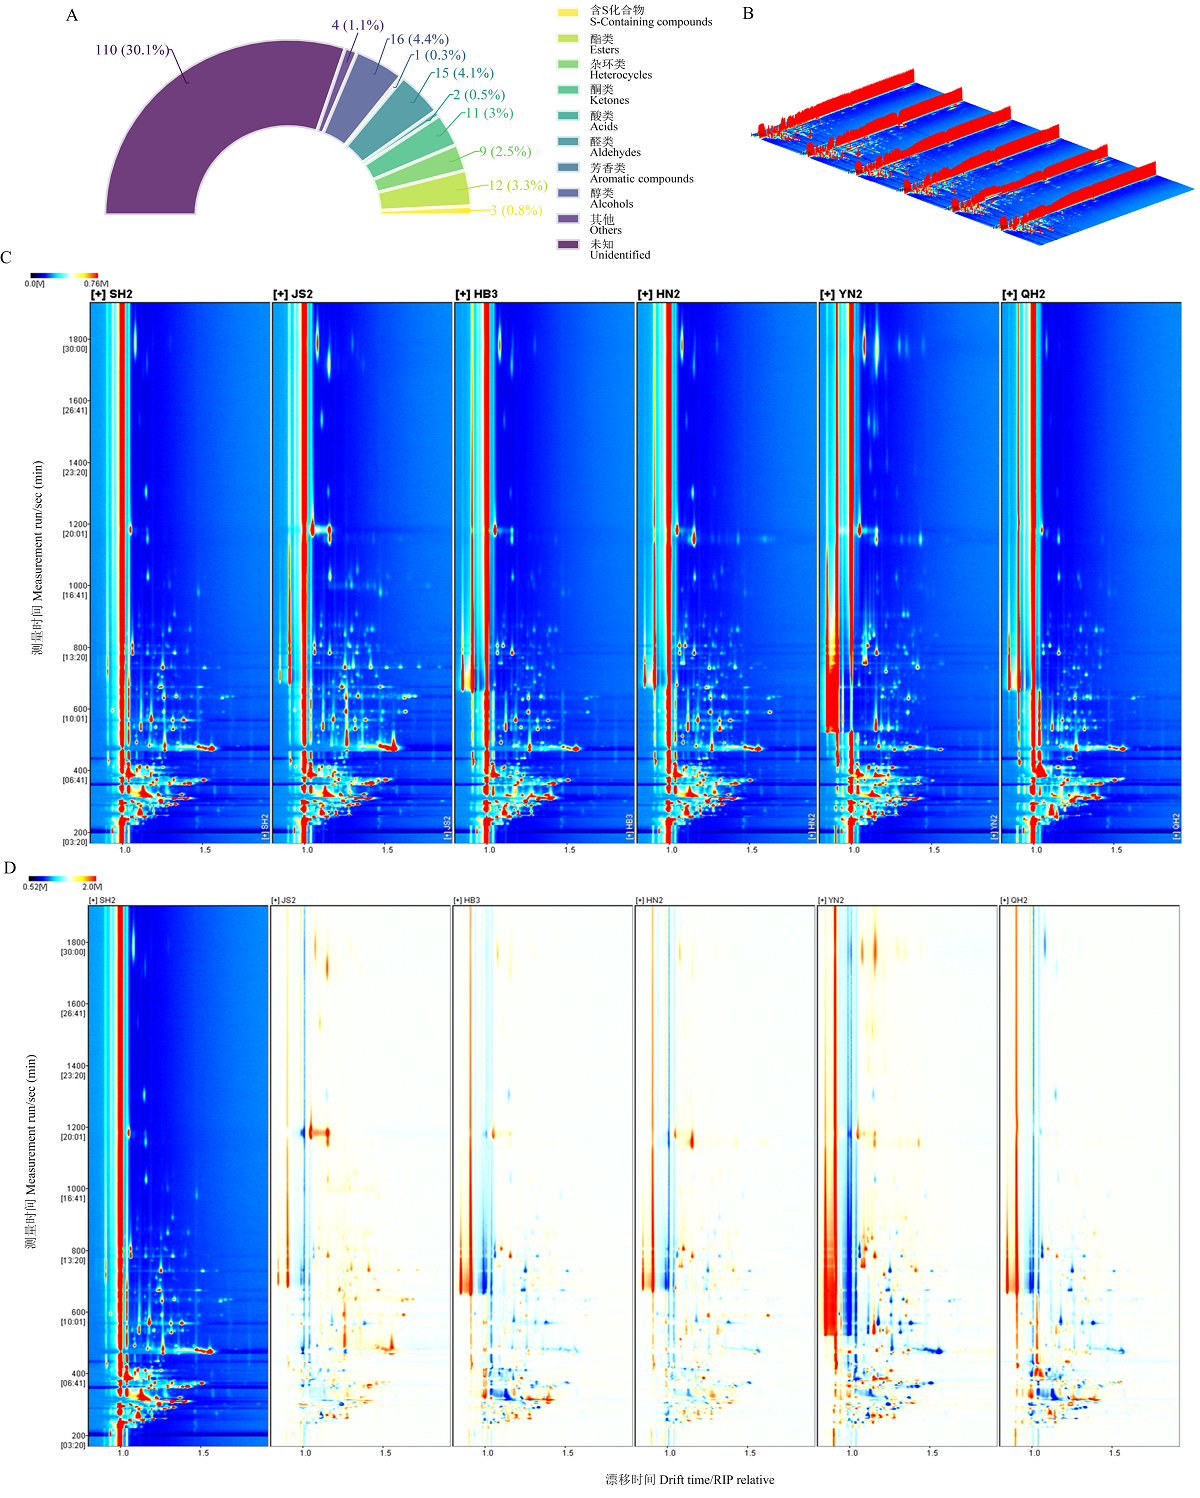
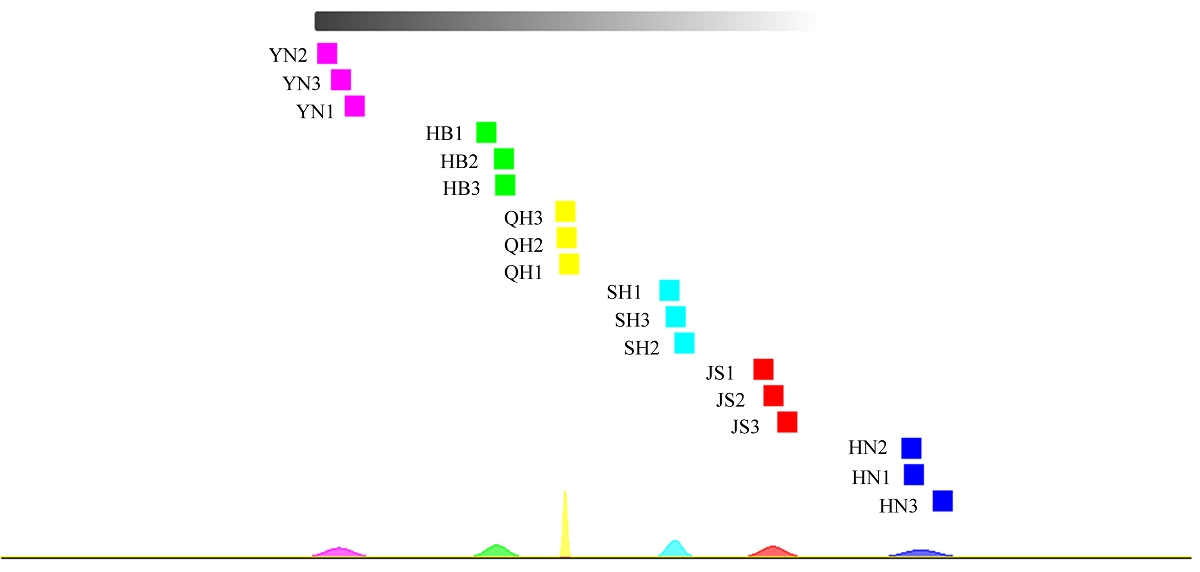
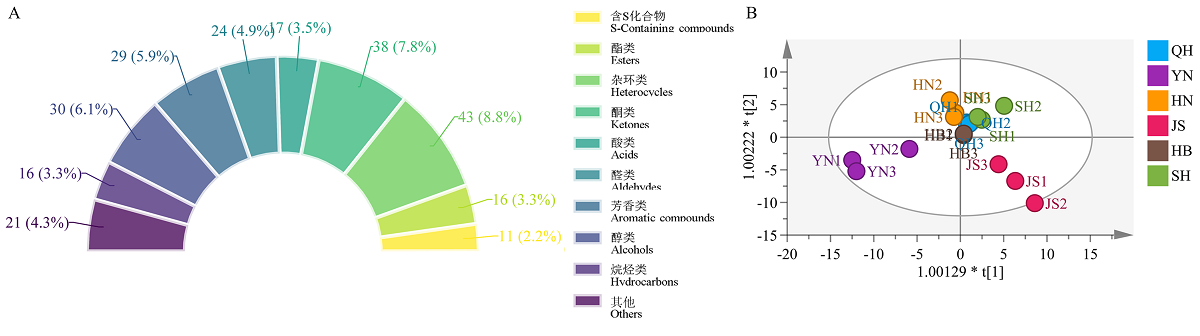
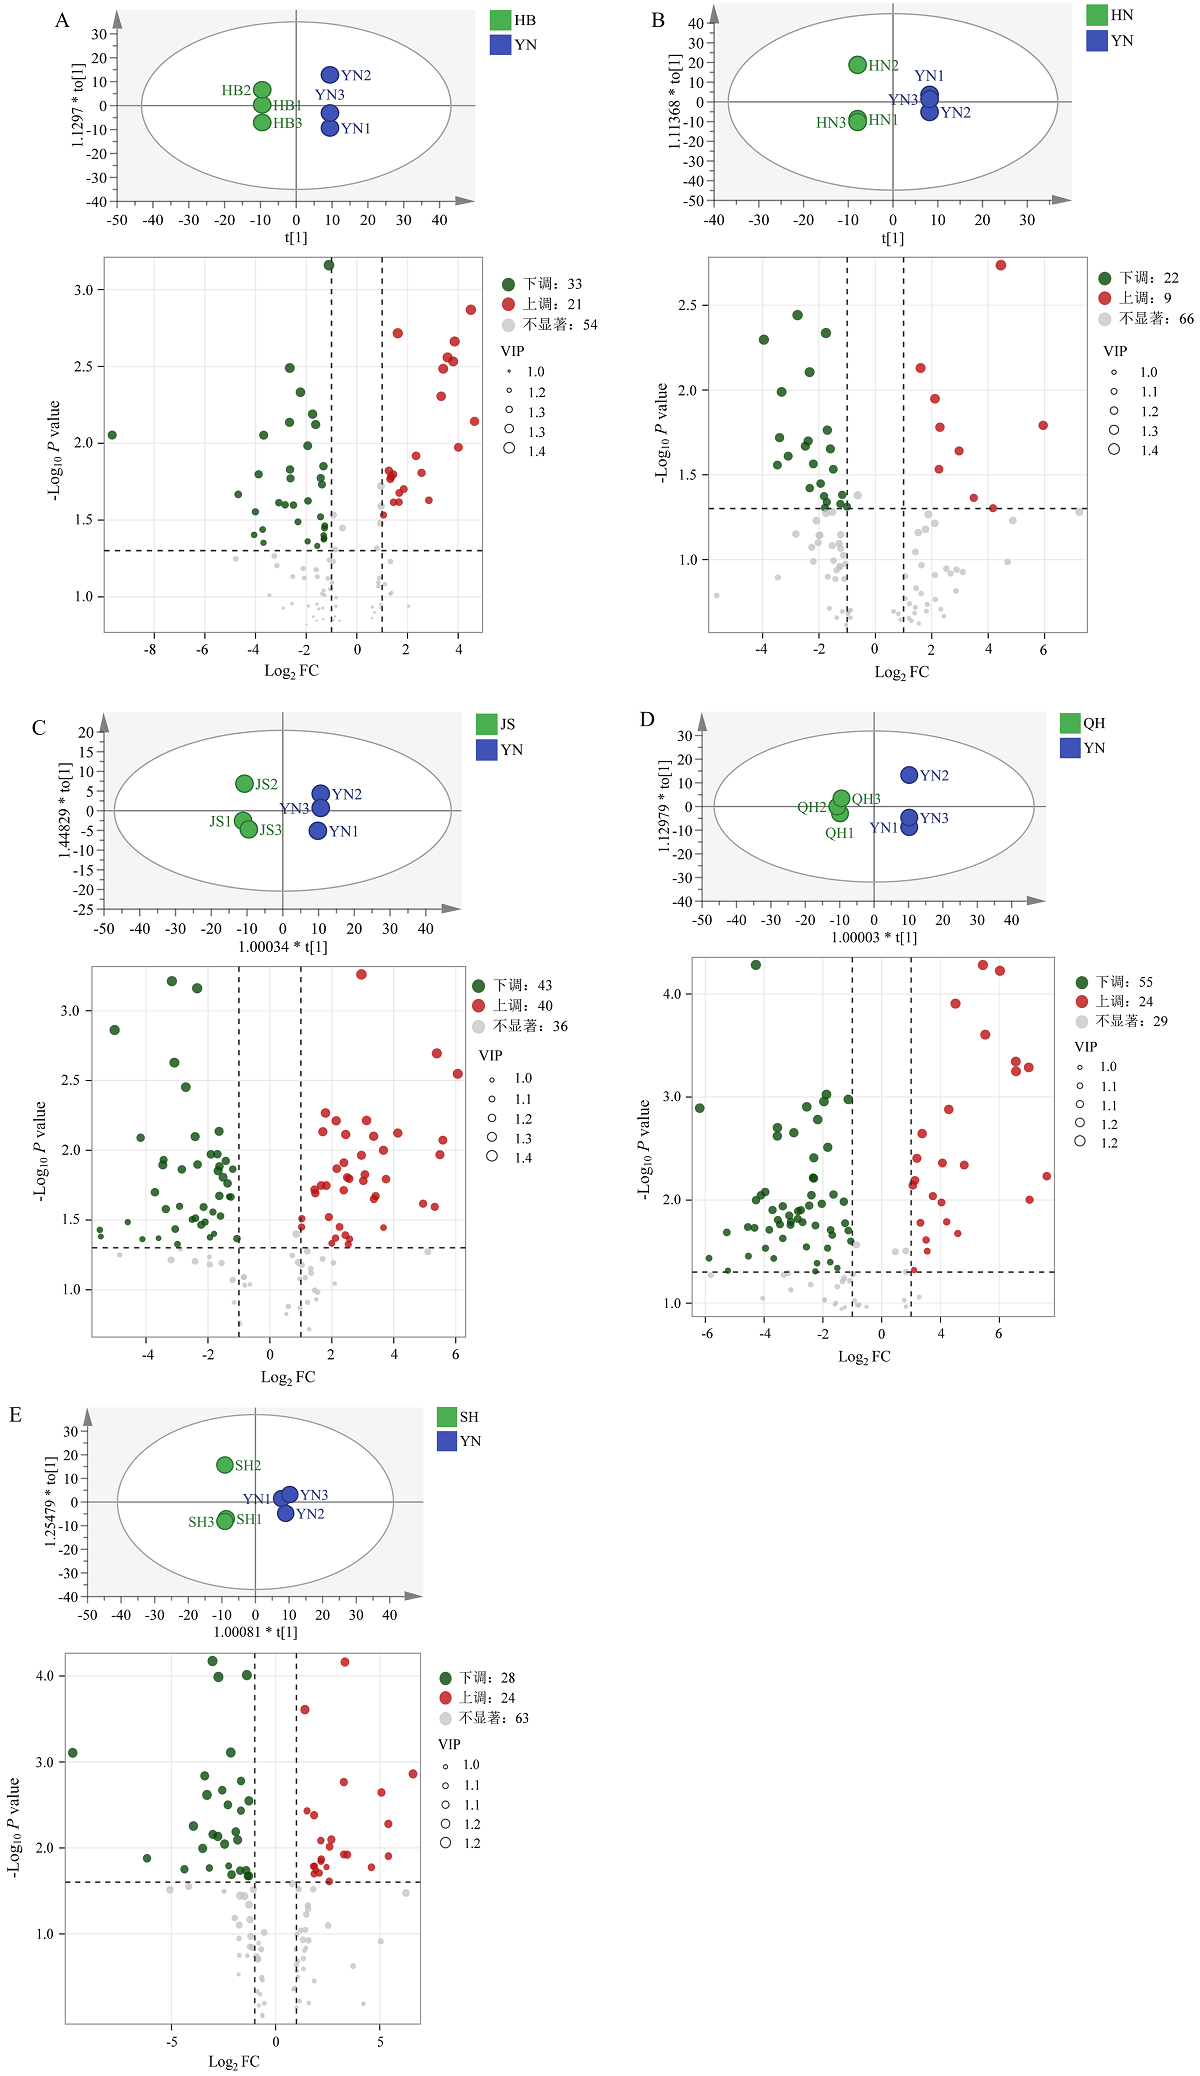
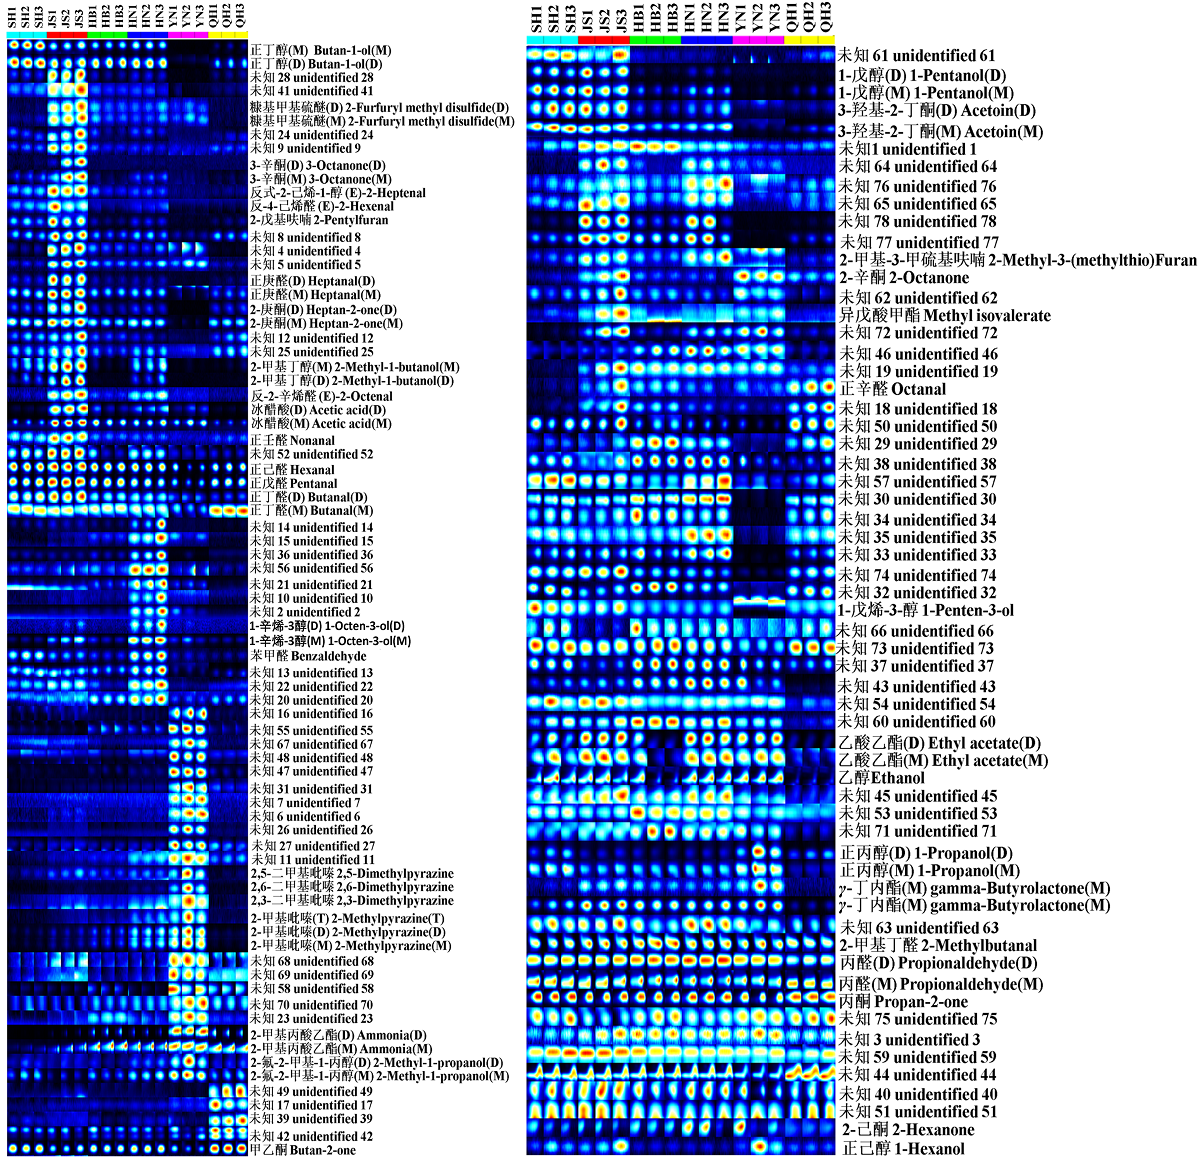
Fig. 2 GC-IMS data of volatile organic compounds in morel morels from different origins A-D: Statistical plots of the number of classifications, three-dimensional spectrograms, direct comparison plots of spectrograms, and comparison plots of differences, respectively. SH: Shanghai; HN: Hunan; HB: Hubei; YN: Yunnan; JS: Jiangsu; QH: Qinghai. The same as below
Other figure/table from this article