×
模态框(Modal)标题
在这里添加一些文本
Close
Close
Submit
Cancel
Confirm
×
模态框(Modal)标题
×
Journal
Article
Figure
Search
Sign In
Scientia Agricultura Sinica
About journal
About journal
Editorial board
Indexed-in
Browse
Accepted
Current Issue
Archive
Most Download
Most Read
Most Cited
Browse by Column
Special Issue
Virtual Issue
Author Center
Submission
Guidelines
Manuscript Writing
Copyright Agreement
Template
Charges
Subscription
Contact us
中文
About journal
About journal
Editorial board
Indexed-in
Browse
Accepted
Current Issue
Archive
Most Download
Most Read
Most Cited
Browse by Column
Special Issue
Virtual Issues
Author Center
Submission
Guidelines
Manuscript Writing
Copyright Agreement
Template
Charges
Subscription
Contact us
中文
Figure/Table detail
Effects of Origin on the Volatile Flavor Components of Morels Based on GC-IMS and GC×GC-ToF-MS
ZHOUXiaoQian, LIXiaoBei, ZHANGYanMei, ZHOUChangYan, RENJiaLi, ZHAOXiaoYan
Scientia Agricultura Sinica
, 2024, 57(
22
): 4553-4567. DOI:
10.3864/j.issn.0578-1752.2024.22.013
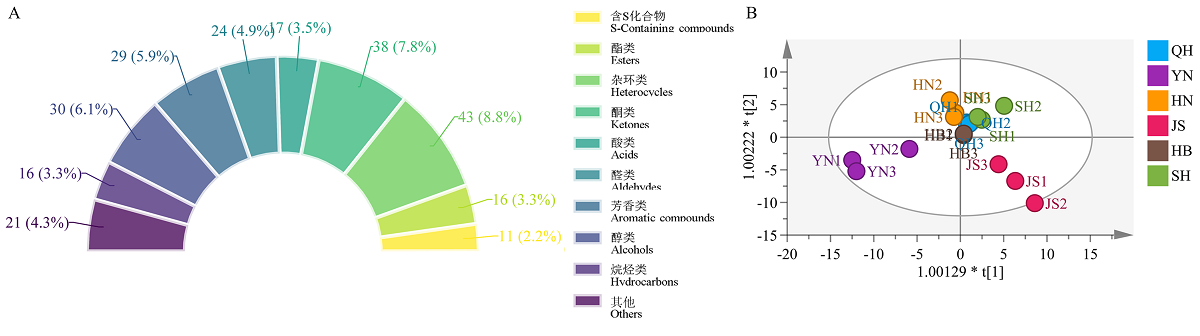
Fig. 5
GC×GC-ToF-MS data of volatile organic compounds of morels from different origins
A: Statistical charts of quantitative classifications; B: PCA analytical charts
Other figure/table from this article
Fig. 4
Nearest neighbor fingerprints of volatile organic compounds in morels from different origins based on GC-IMS from different origins of morel mushroom
Fig. 6
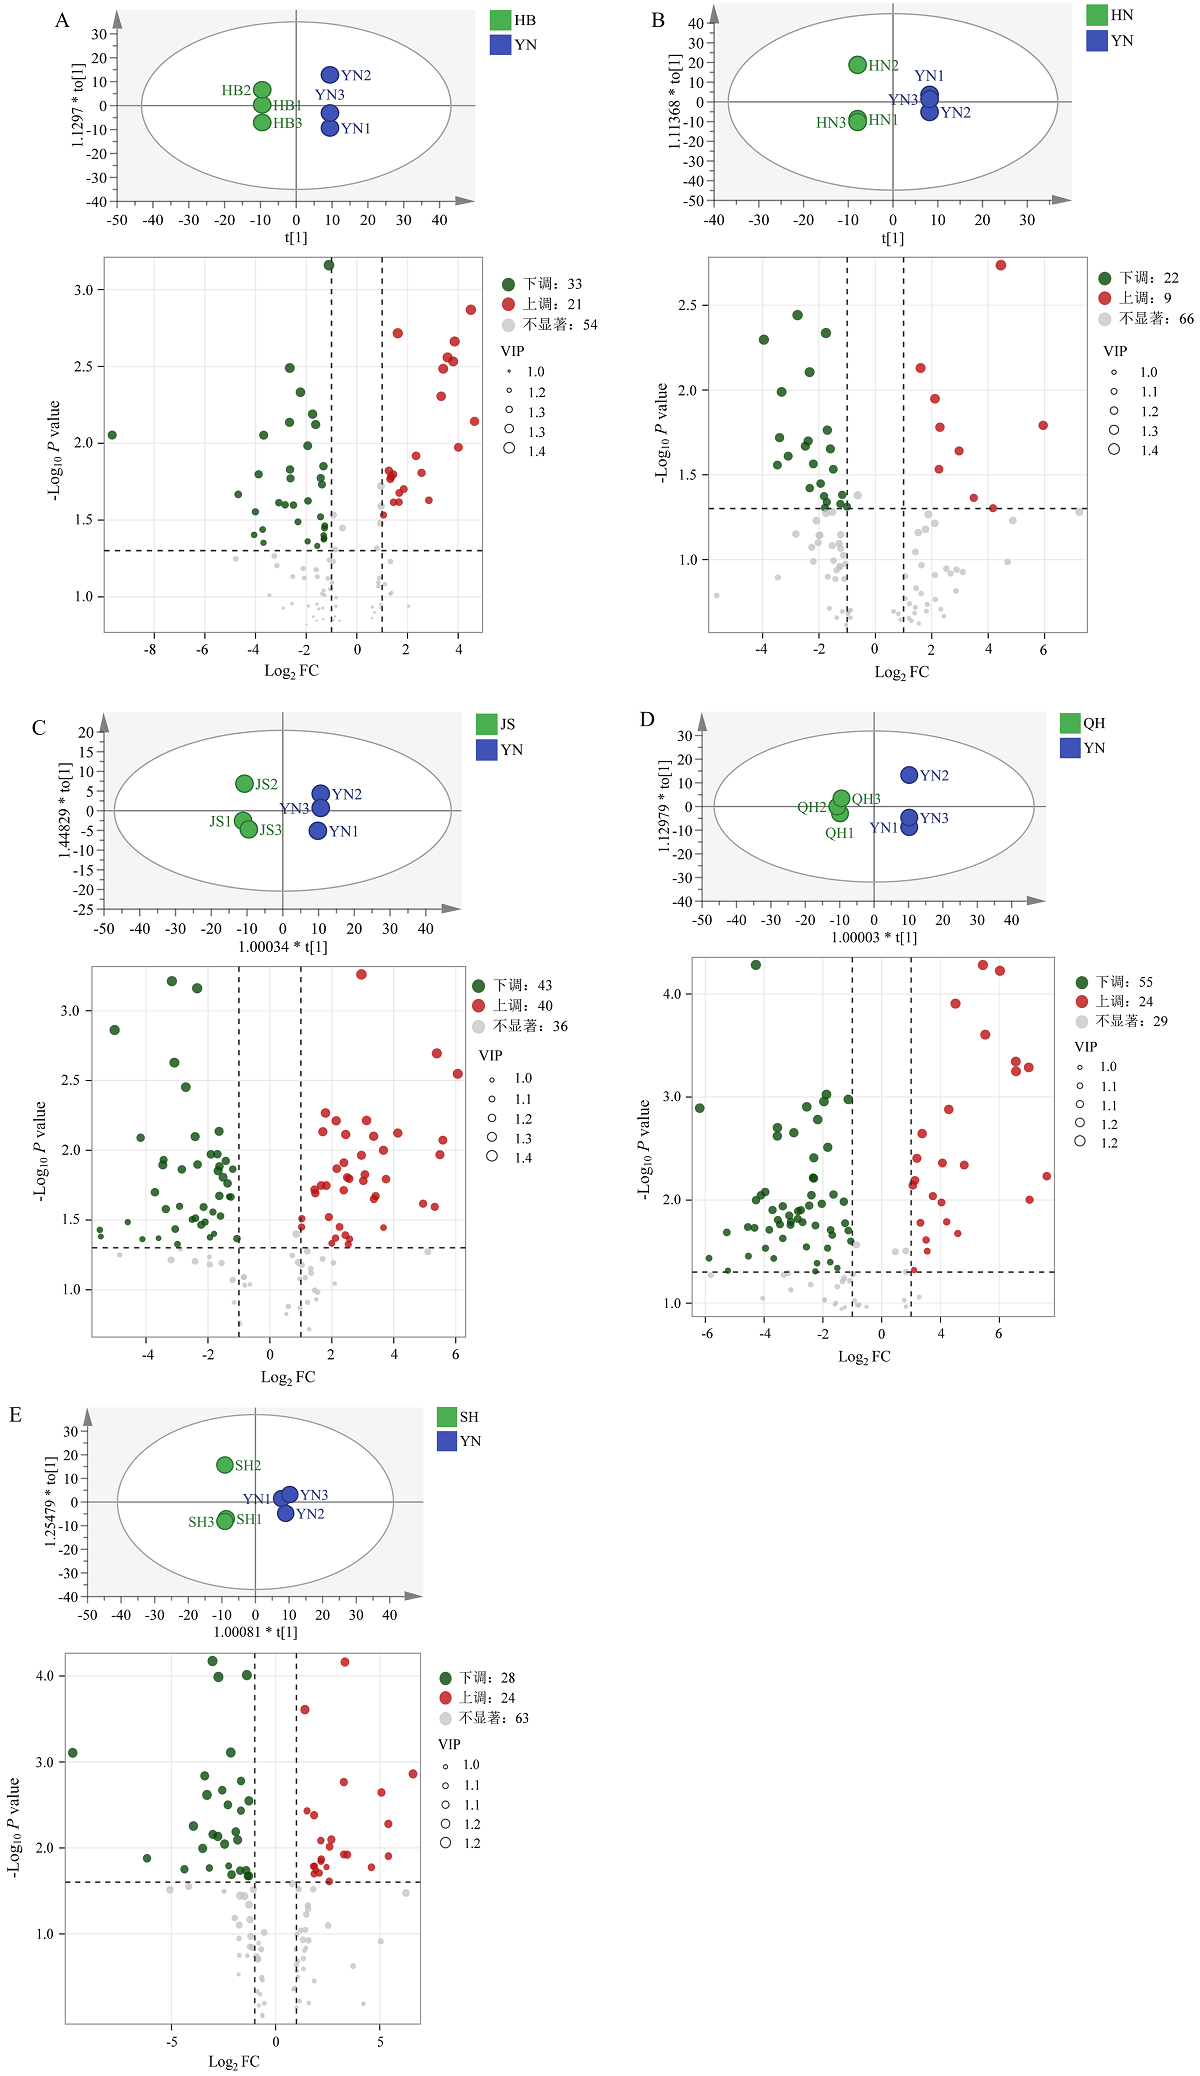
OPLS-DA and volcano plots of volatile components identified by GC×GC-ToF-MS in morels from different origins
A-E: Hubei vs Yunnan, Hunan vs Yunnan, Jiangsu vs Yunnan, Qinghai vs Yunnan, Shanghai vs Yunnan, respectively
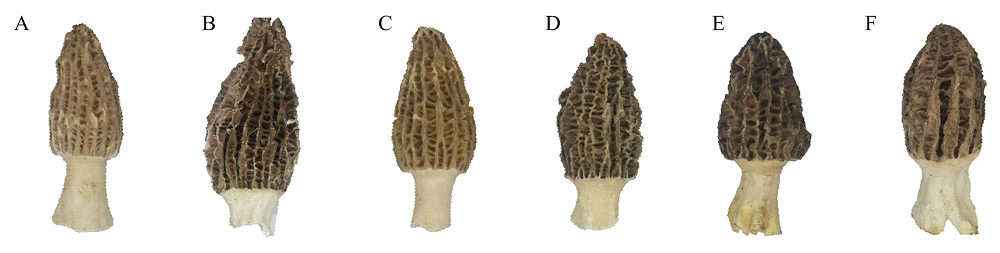
Fig. 1
Morel sample pictures from various regions
A-F: Pictures of morel samples from Shanghai, Jiangsu, Hubei, Hunan, Yunnan, and Qinghai, respectively
Table 1
Morel sample cultivation information
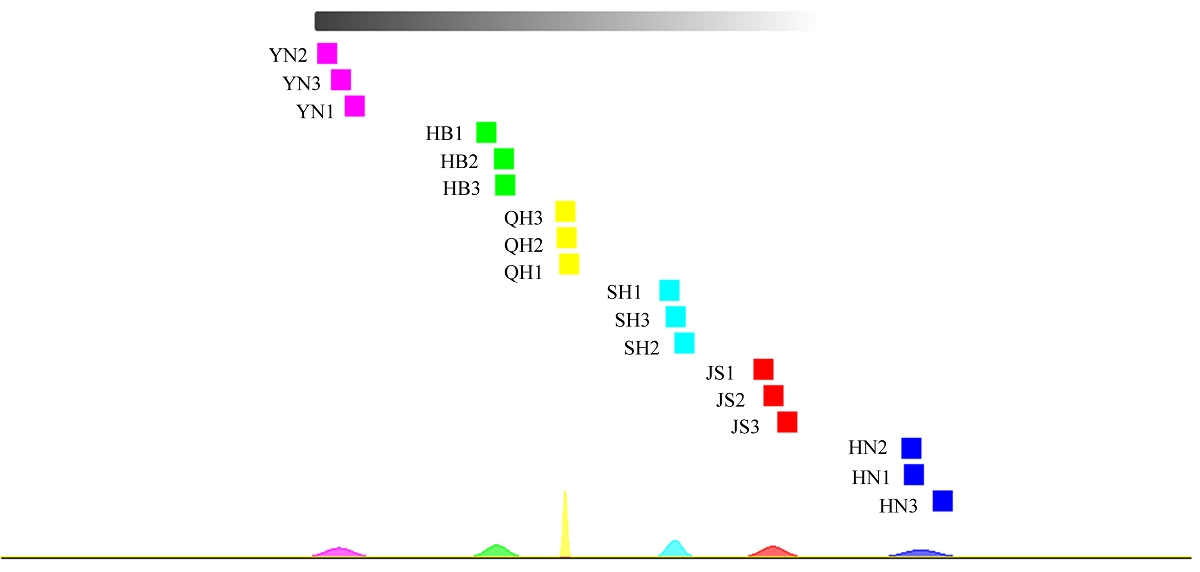
Fig. 2
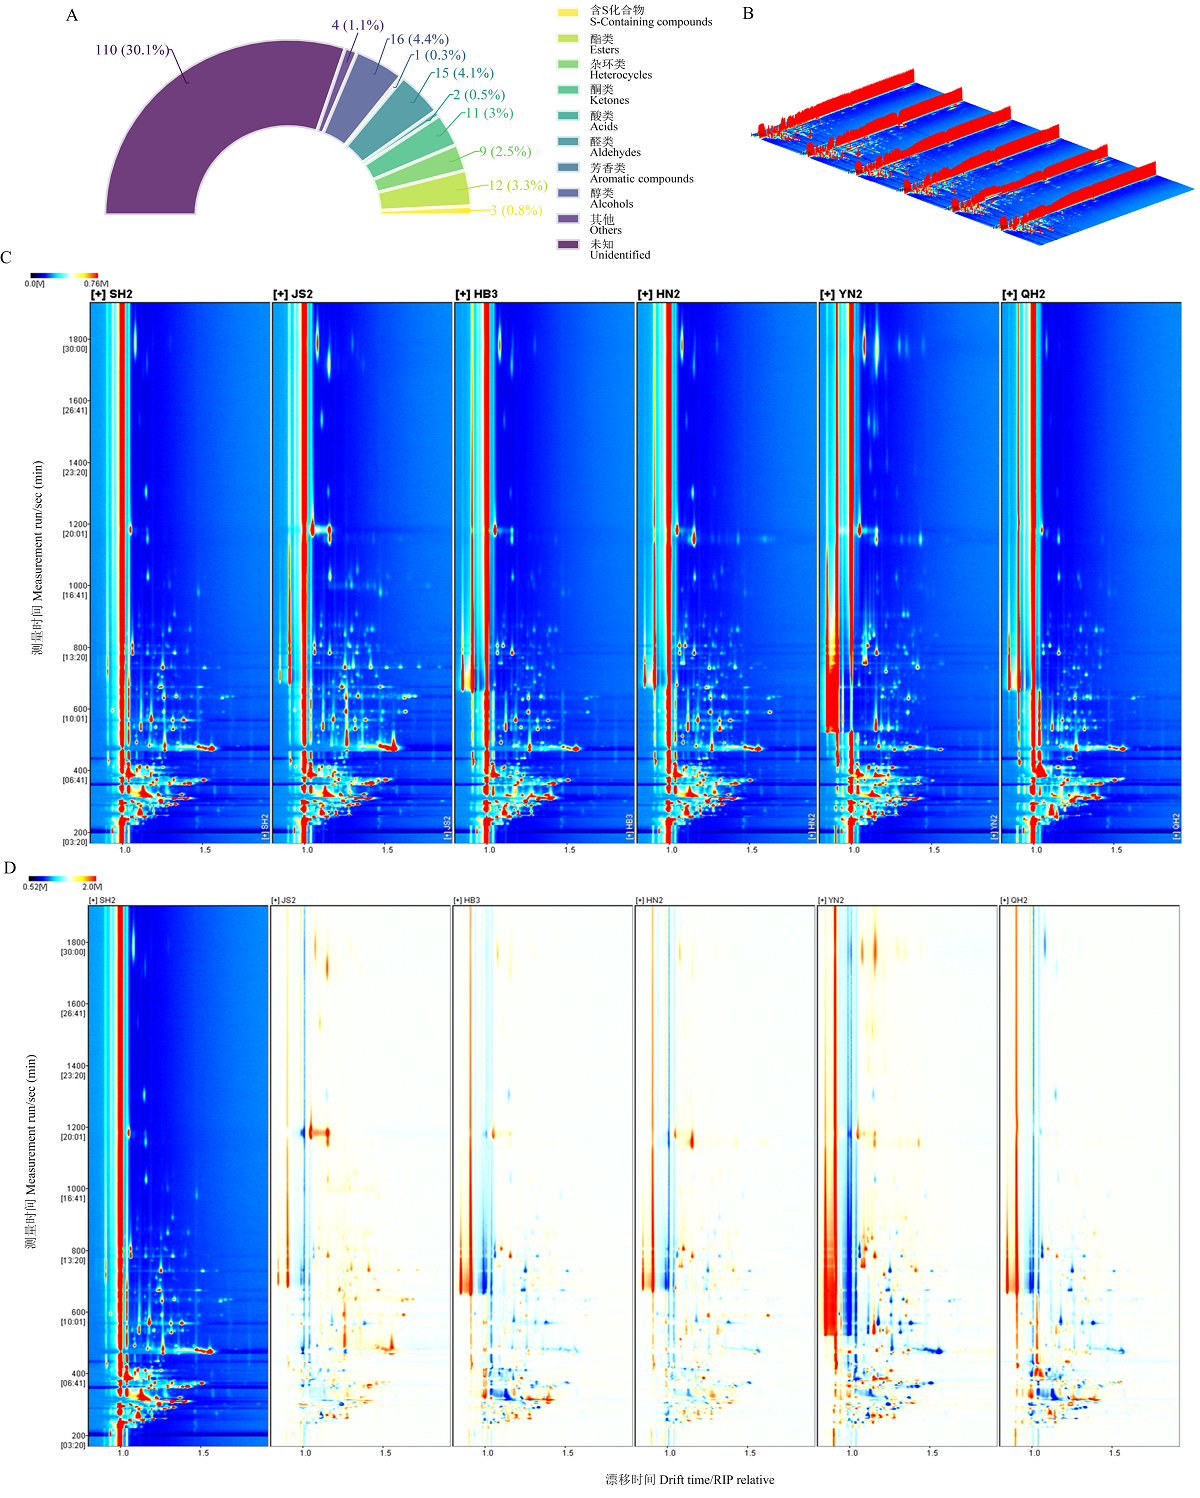
GC-IMS data of volatile organic compounds in morel morels from different origins
A-D: Statistical plots of the number of classifications, three-dimensional spectrograms, direct comparison plots of spectrograms, and comparison plots of differences, respectively. SH: Shanghai; HN: Hunan; HB: Hubei; YN: Yunnan; JS: Jiangsu; QH: Qinghai. The same as below
Fig. 7
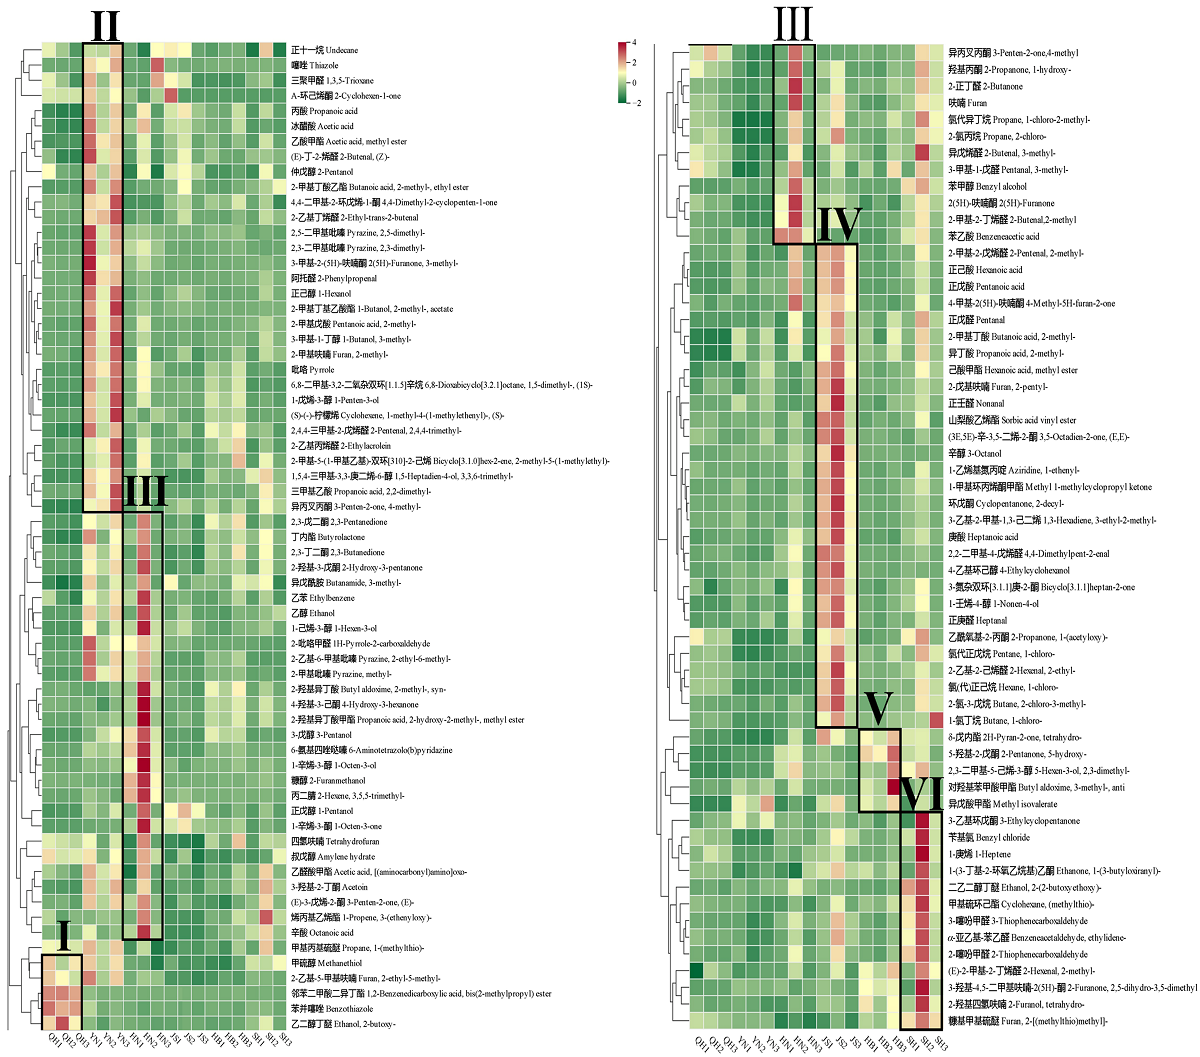
Heat map of differential volatile components based on GC×GC-ToF-MS of morels from different origins
Fig. 8
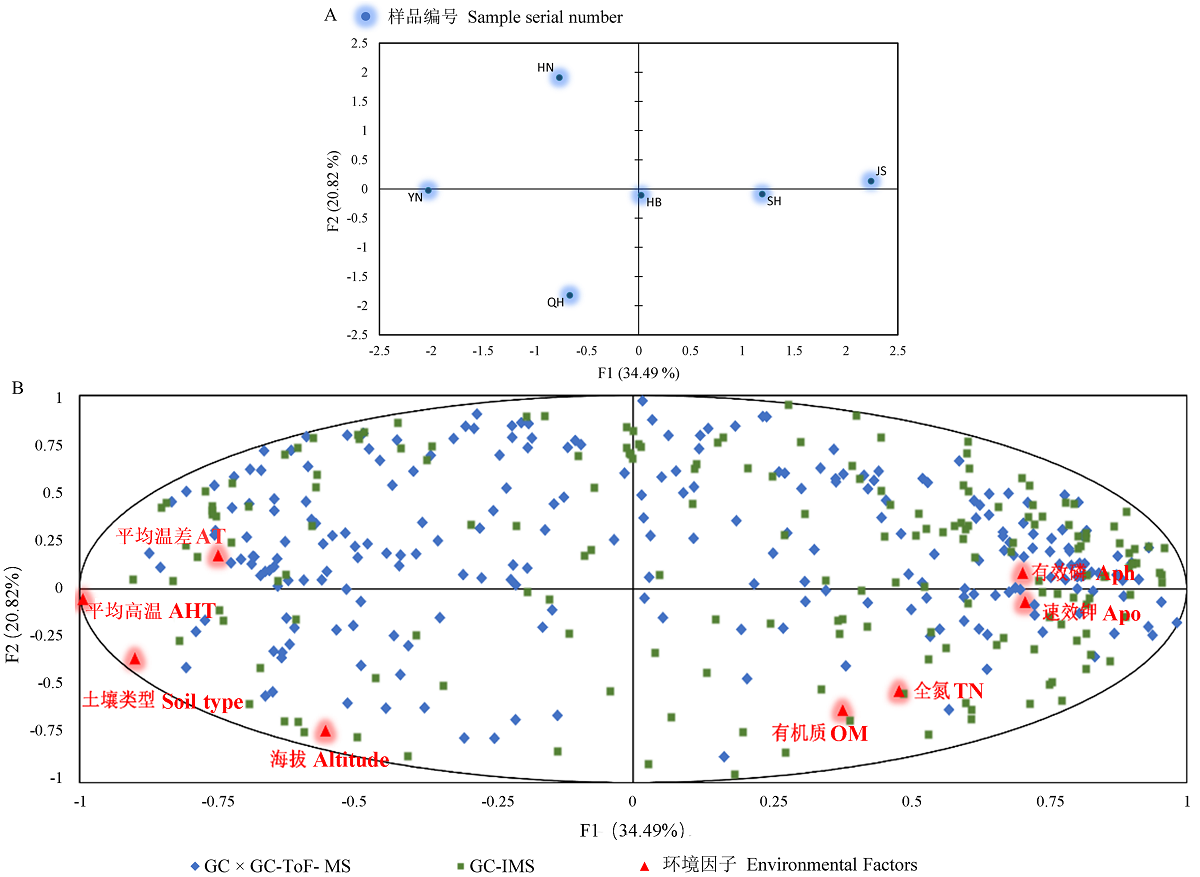
Multi-factor analysis plot of volatile compounds and environmental factors
A: MFA analysis of each sample group; B: MFA analysis of volatiles identified by GC×GC-ToF-MS and GC-IMS and environmental factorsAT: Average temperature difference; AHT: Average high temperature; Aph: Available phosphorus; Apo: Available potassium; TN: Total nitrogen; OM: Organic matter
Fig. 3
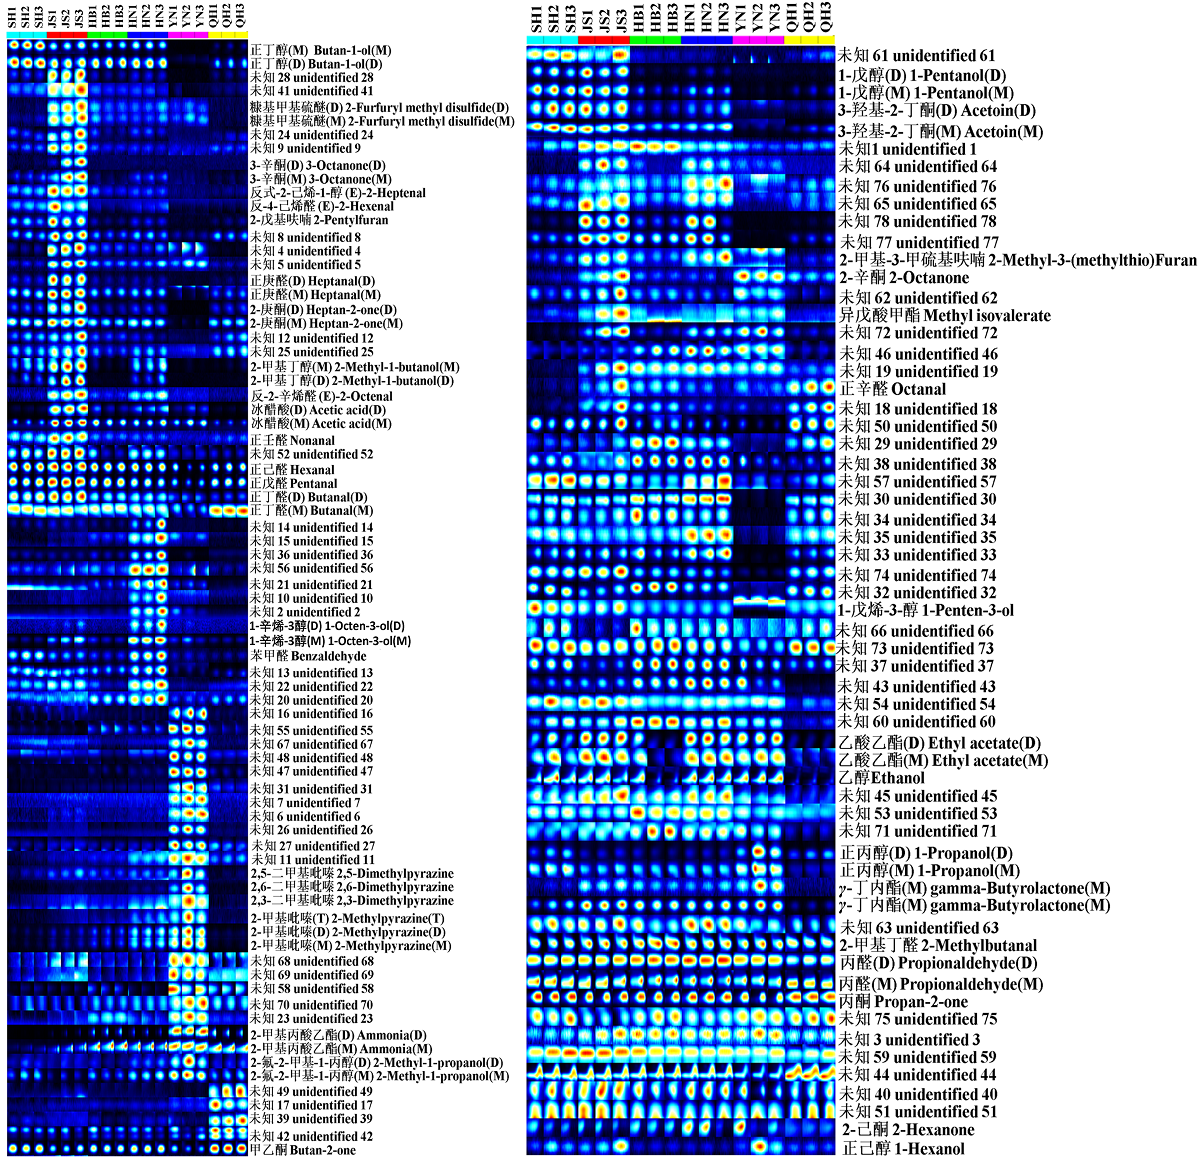
Fingerprints of volatile substances in morel morels from different origins
Table 2
OAV of the main aroma active components of
Agaricus blazei
from different regions