×
模态框(Modal)标题
在这里添加一些文本
Close
Close
Submit
Cancel
Confirm
×
模态框(Modal)标题
×
Journal
Article
Figure
Search
Sign In
Cotton Science
About journal
About journal
Editorial board
Indexed-in
Browse
Accepted
Current Issue
Archive
Most Download
Most Read
Most Cited
Browse by Column
Special Issue
Virtual Issue
Author Center
Submission
Guidelines
Manuscript Writing
Copyright Agreement
Template
Charges
Subscription
Contact us
中文
About journal
About journal
Editorial board
Indexed-in
Browse
Accepted
Current Issue
Archive
Most Download
Most Read
Most Cited
Browse by Column
Special Issue
Virtual Issues
Author Center
Submission
Guidelines
Manuscript Writing
Copyright Agreement
Template
Charges
Subscription
Contact us
中文
Figure/Table detail
Relationship between boll temporal distribution and cotton yield under summer direct seeding
Li Xian’en,Ma Xuefeng,Zhang Zhao,Yang Lirong,Lü Na,Yao Xiaofen,Qiu Shen,Zhang Guifen,Yang Guozheng
Cotton Science
, 2022, 34(
5
): 416-429. DOI:
10.11963/cs20210074
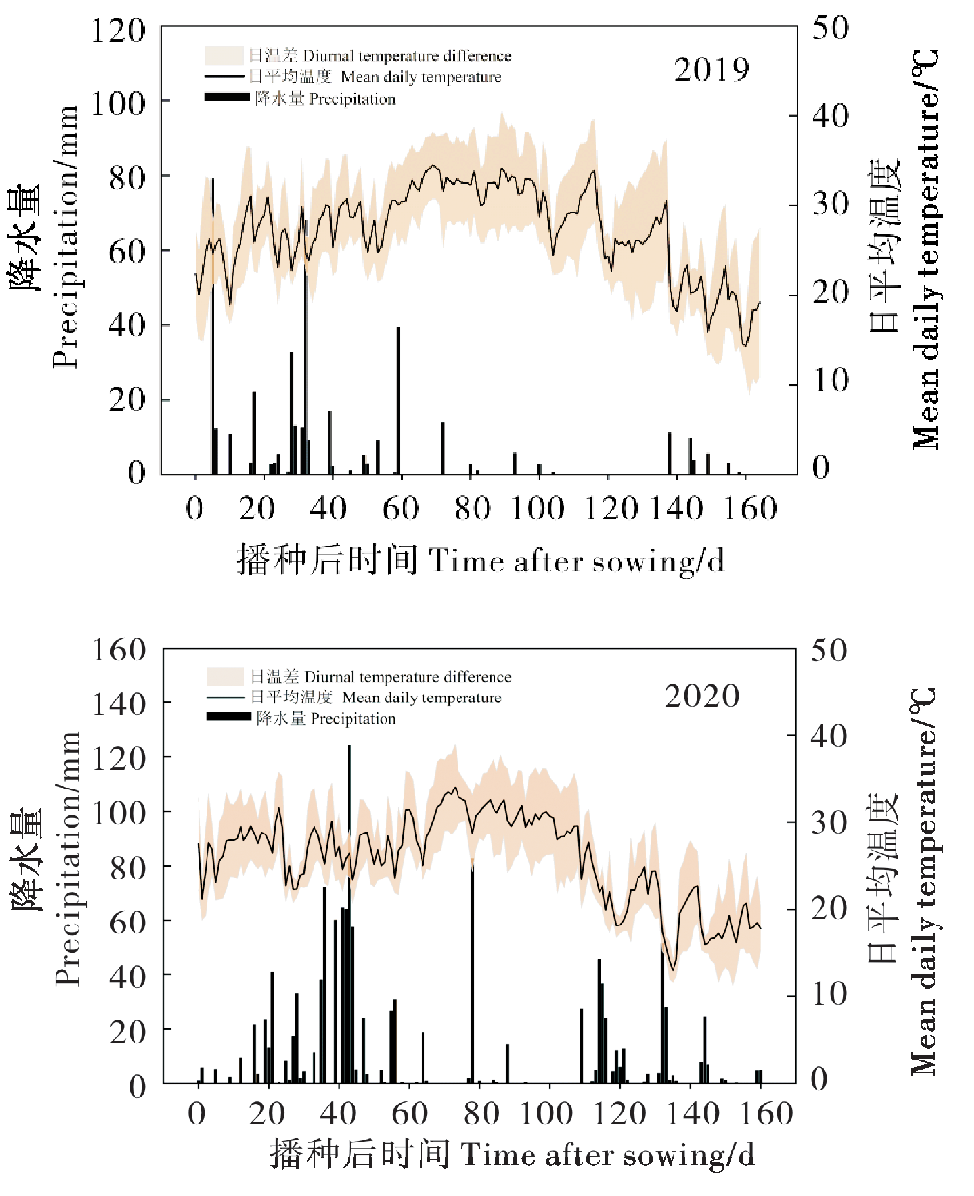
Fig. 1
Temperature and precipitation during the whole cotton growth stage in 2019 and 2020
Other figure/table from this article
Table 1
Development progress and growth stages of cotton
Table 2
Logistic models for the number accumulation of cotton reproduction organs
Table 3
Dynamic characteristic values of the number of reproduction organs in cotton
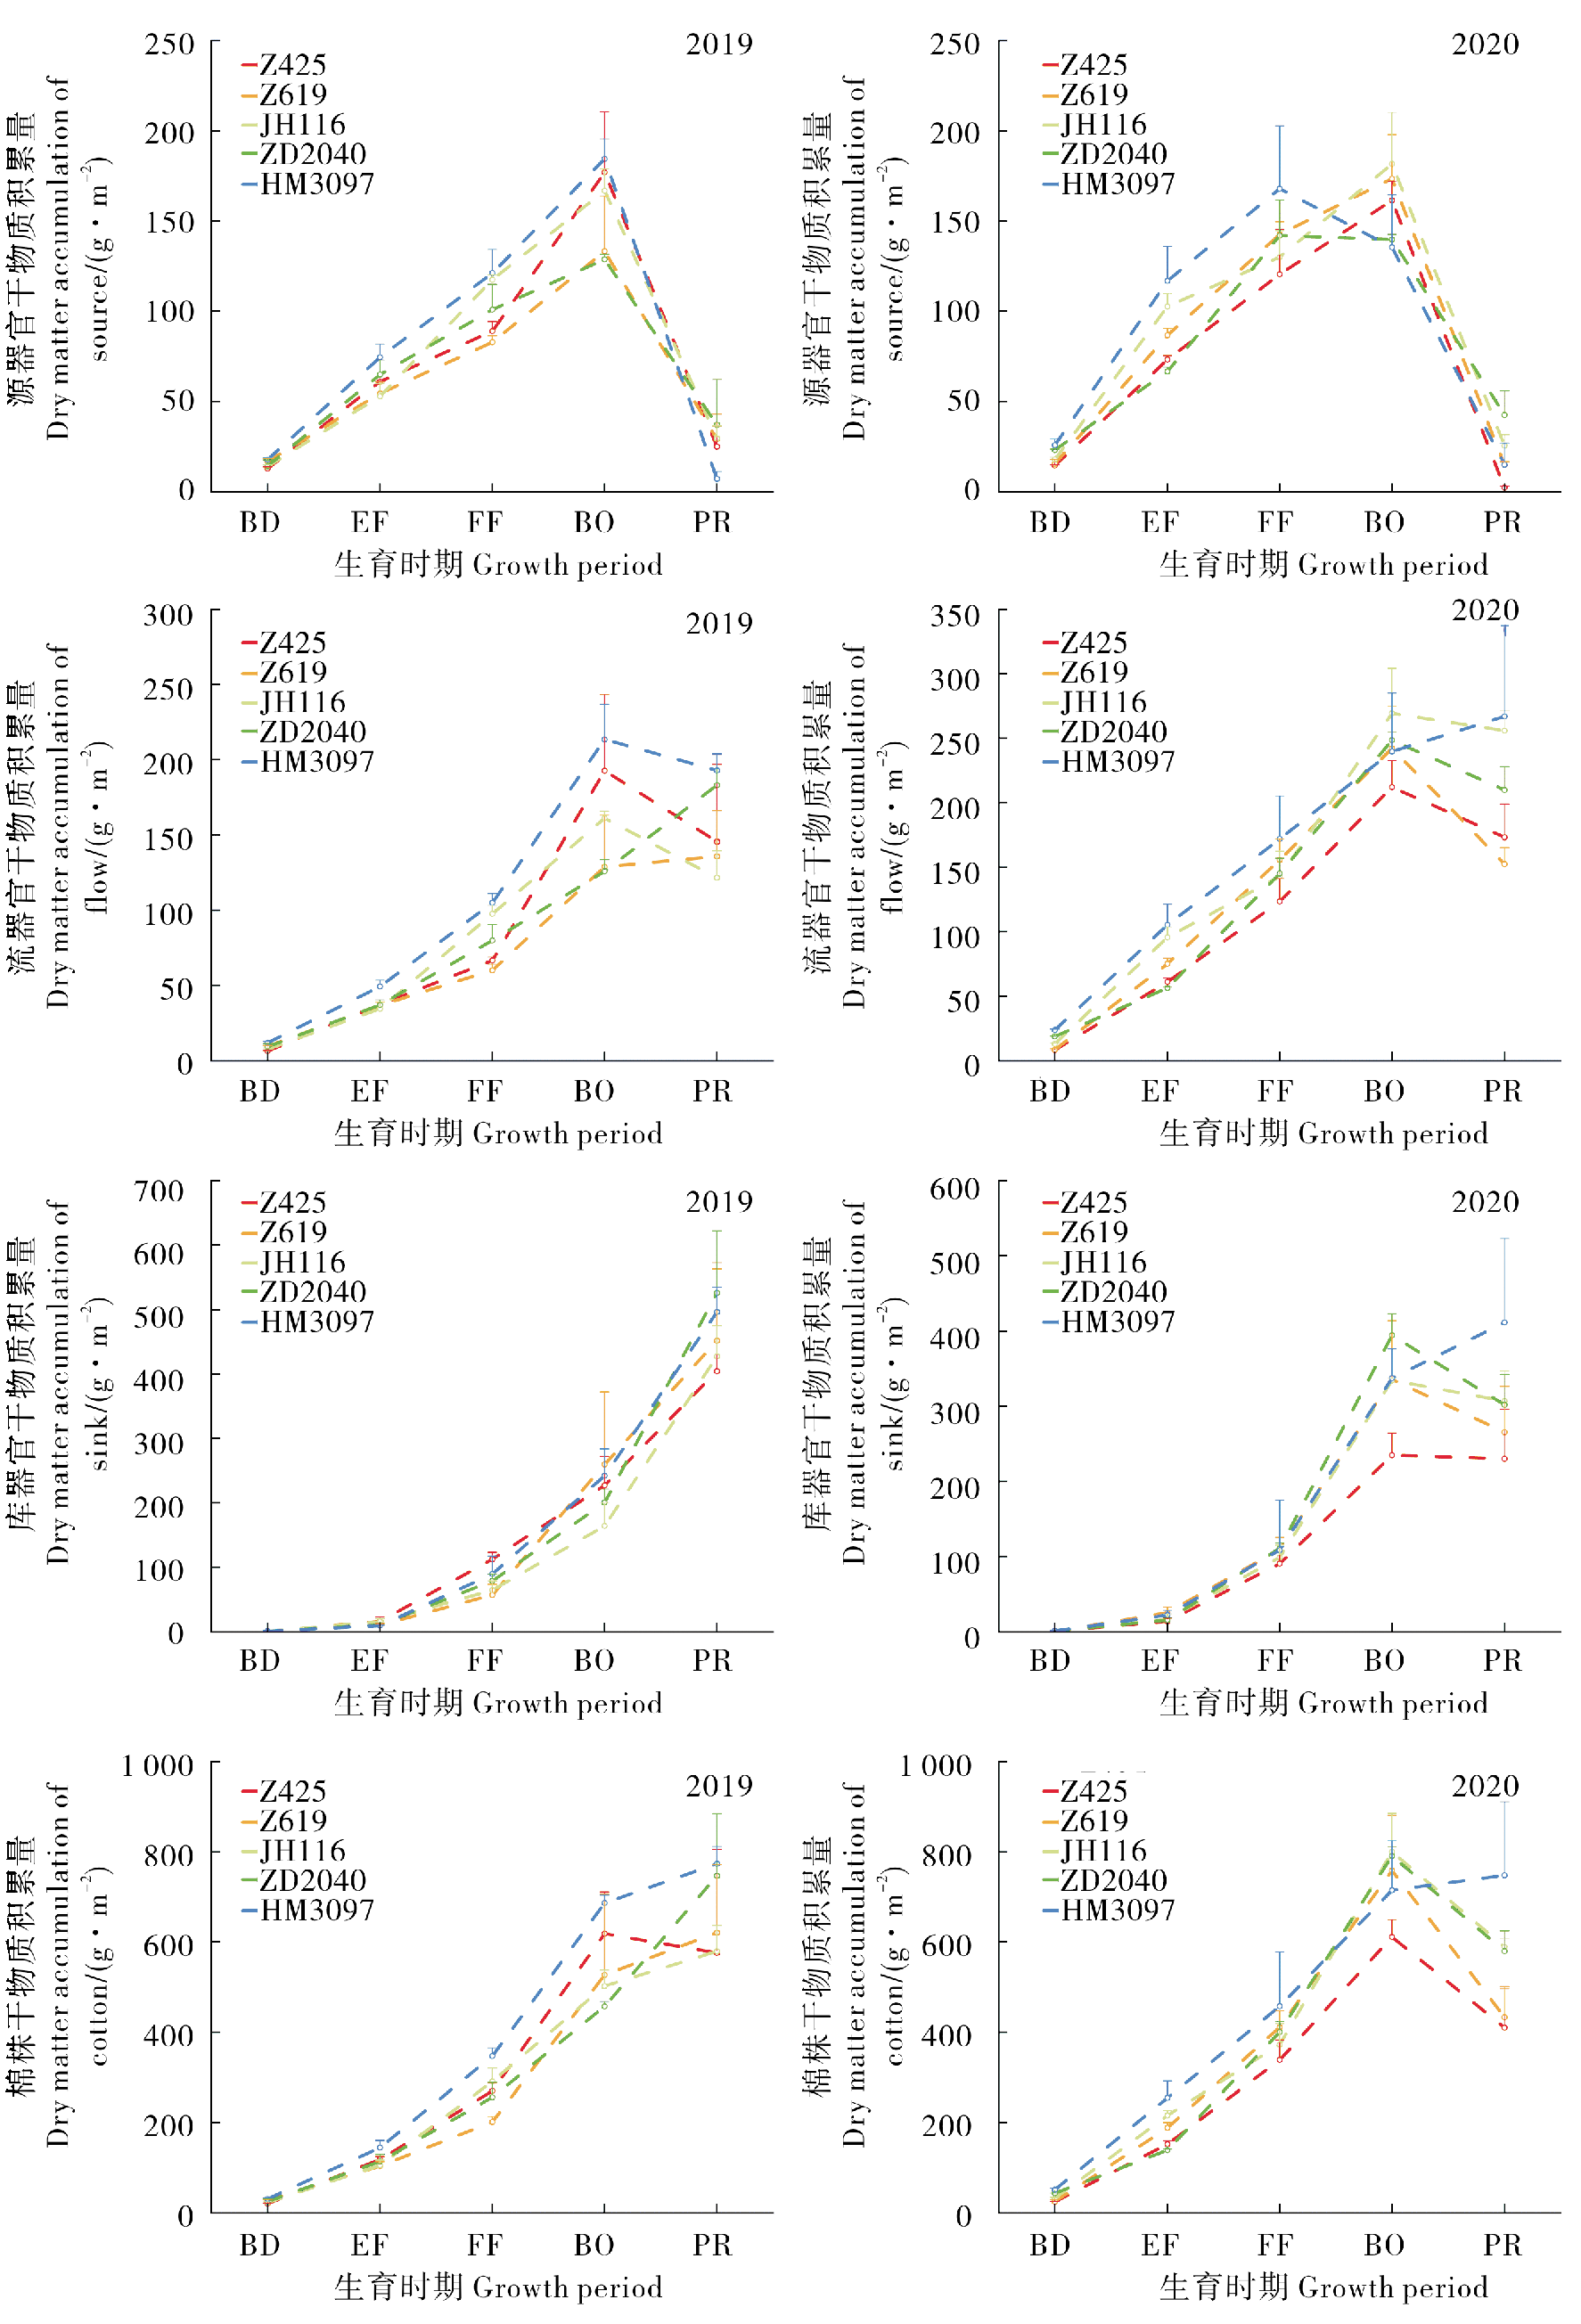
Fig. 2
Dry matter accumulation of cotton at different growth periods
BD is the budding date; EF is the early flowering date; FF is the flourishing flowering date; BO is the boll opening date; PR is the plant removal date.
Table 4
Logistic models for dry matter accumulation in cotton
Table 5
Dynamic characteristic values of cotton dry matter accumulation
Table 6
Cotton yield and its components
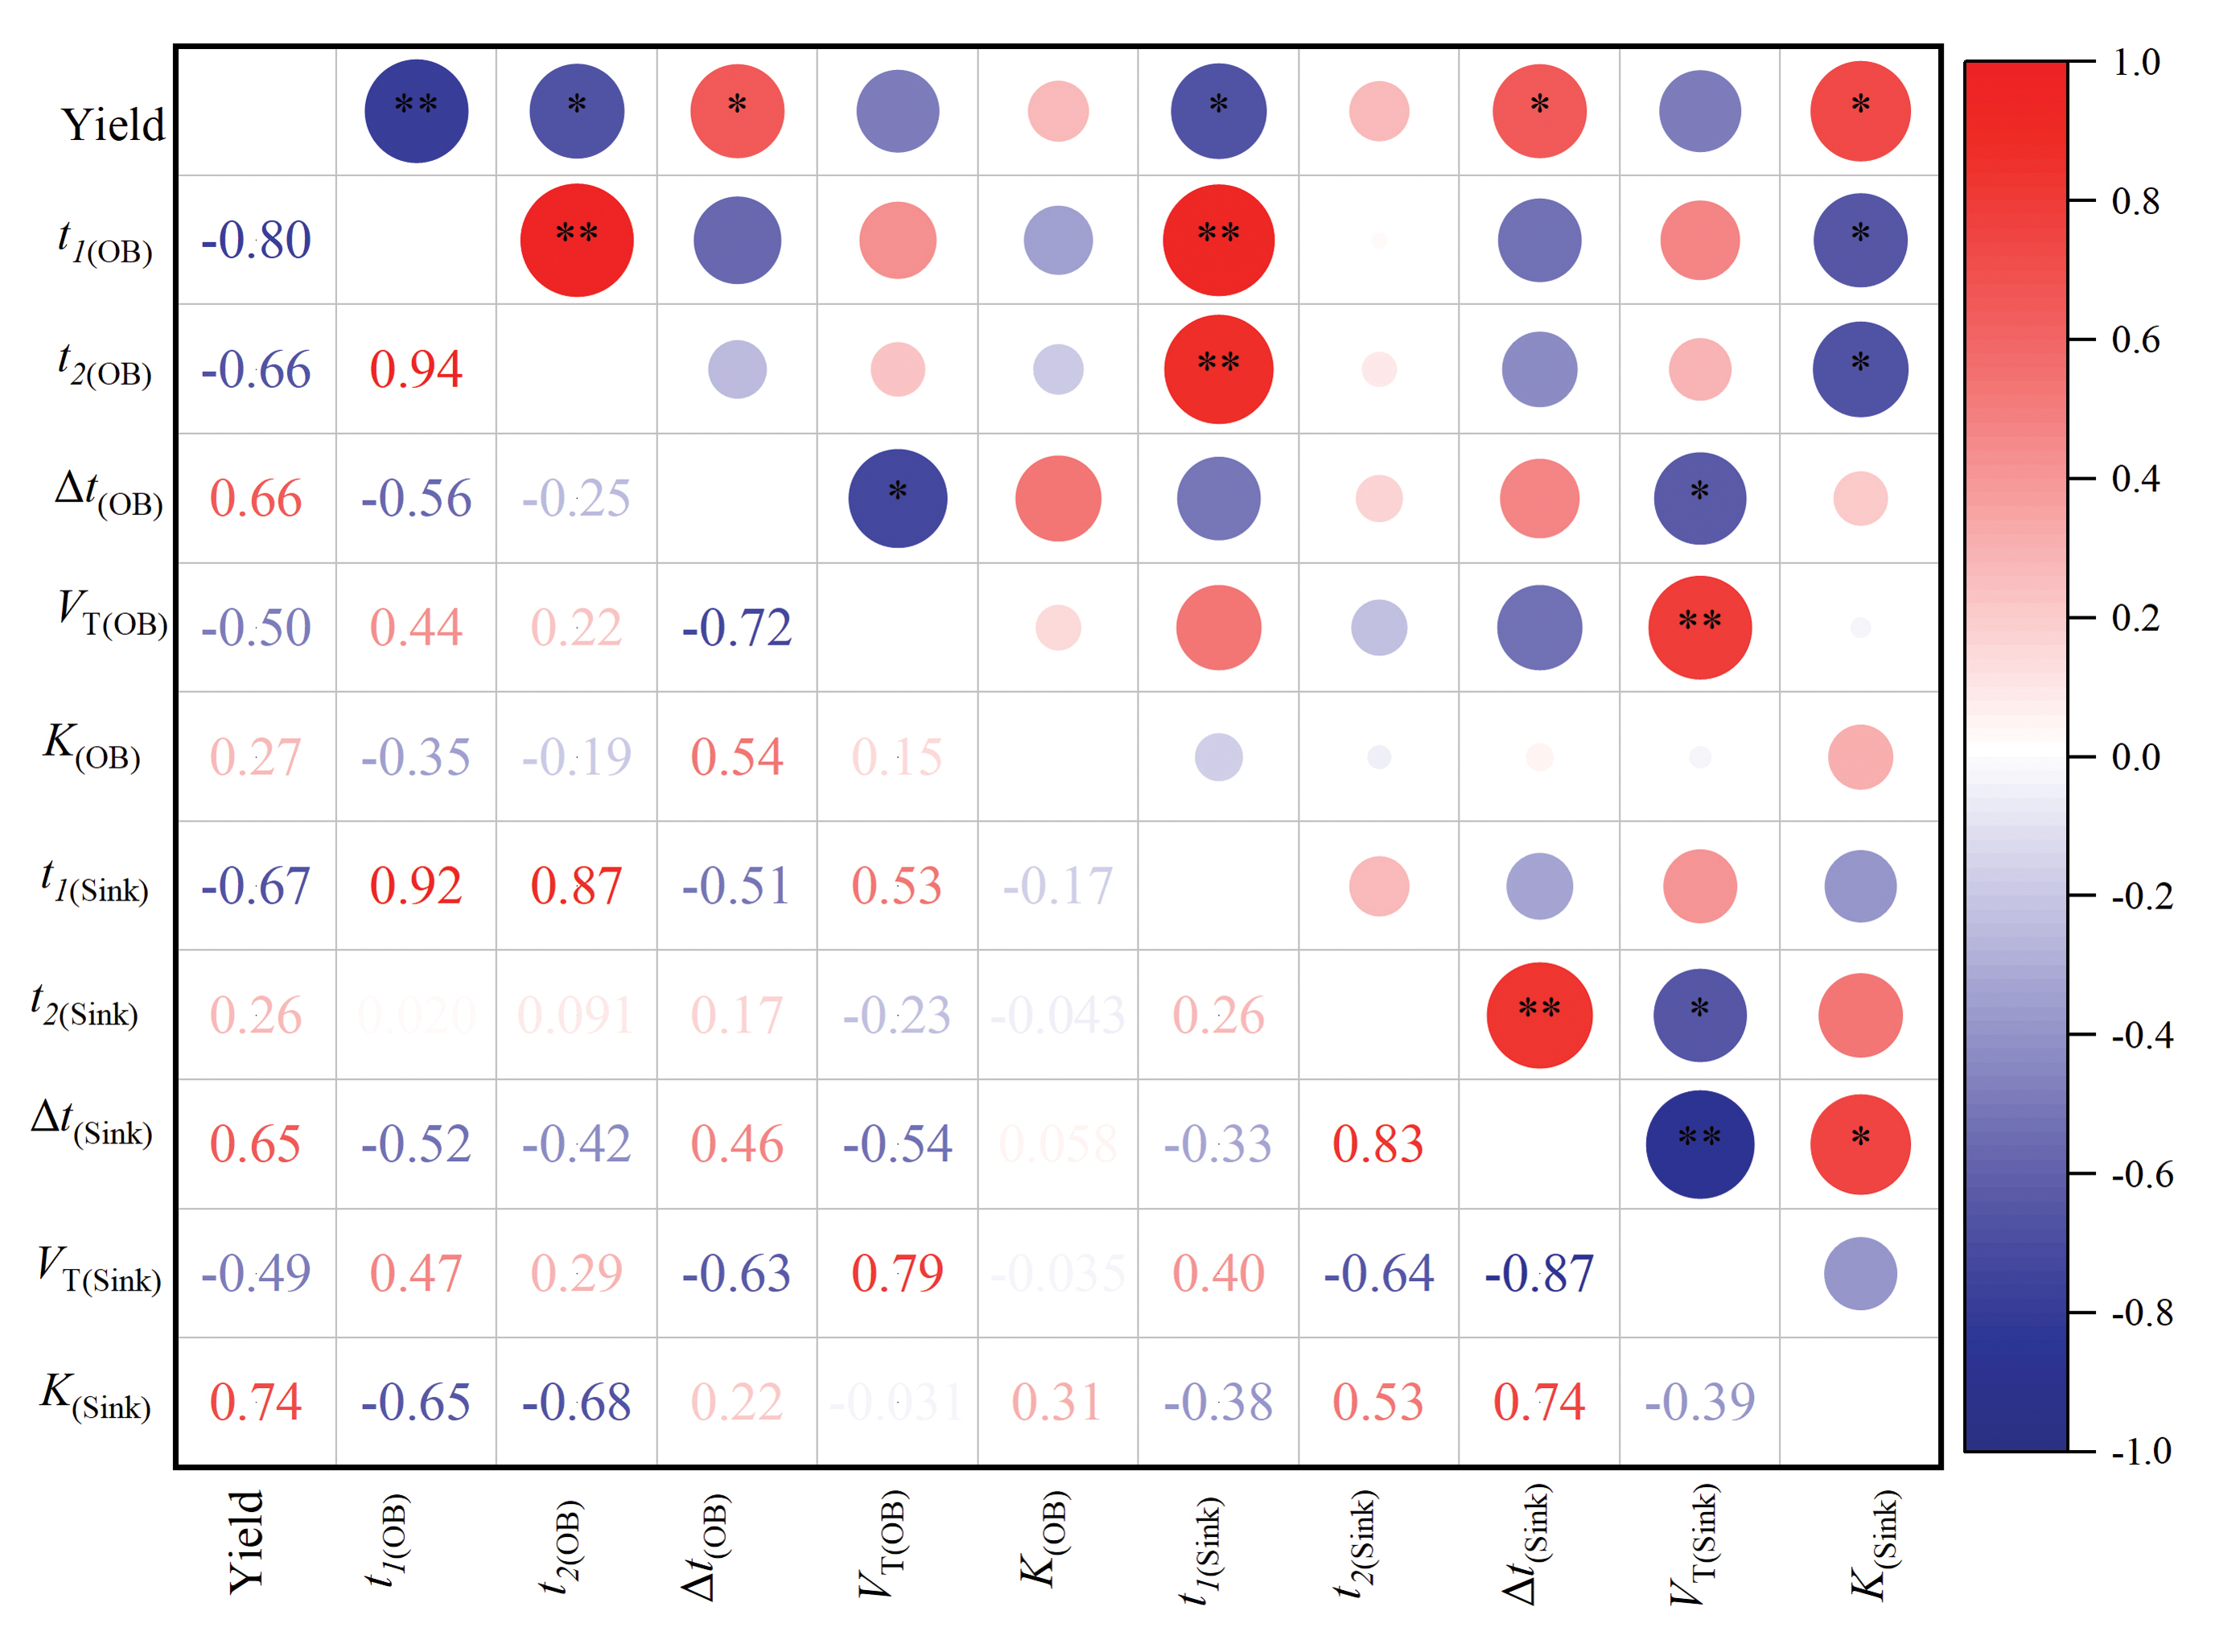
Fig. 3
The correlation analysis between lint yield and the dynamic characteristic values of sink dry matter accumulation and opening boll number
Yield indicates lint yield.
t
1
and
t
2
are the start time and termination time of the fast accumulation period, respectively; Δ
t
indicates the duration of the fast accumulation period;
V
T
is the average accumulation rate during the fast accumulation period.
K
is the theoretical maximum dry matter accumulation or the theoretical maximum number of organs. OB is opening bolls; Sink indicates the sink organs. * and ** indicate significant relationship at the 0.05 and 0.01 level, respectively.