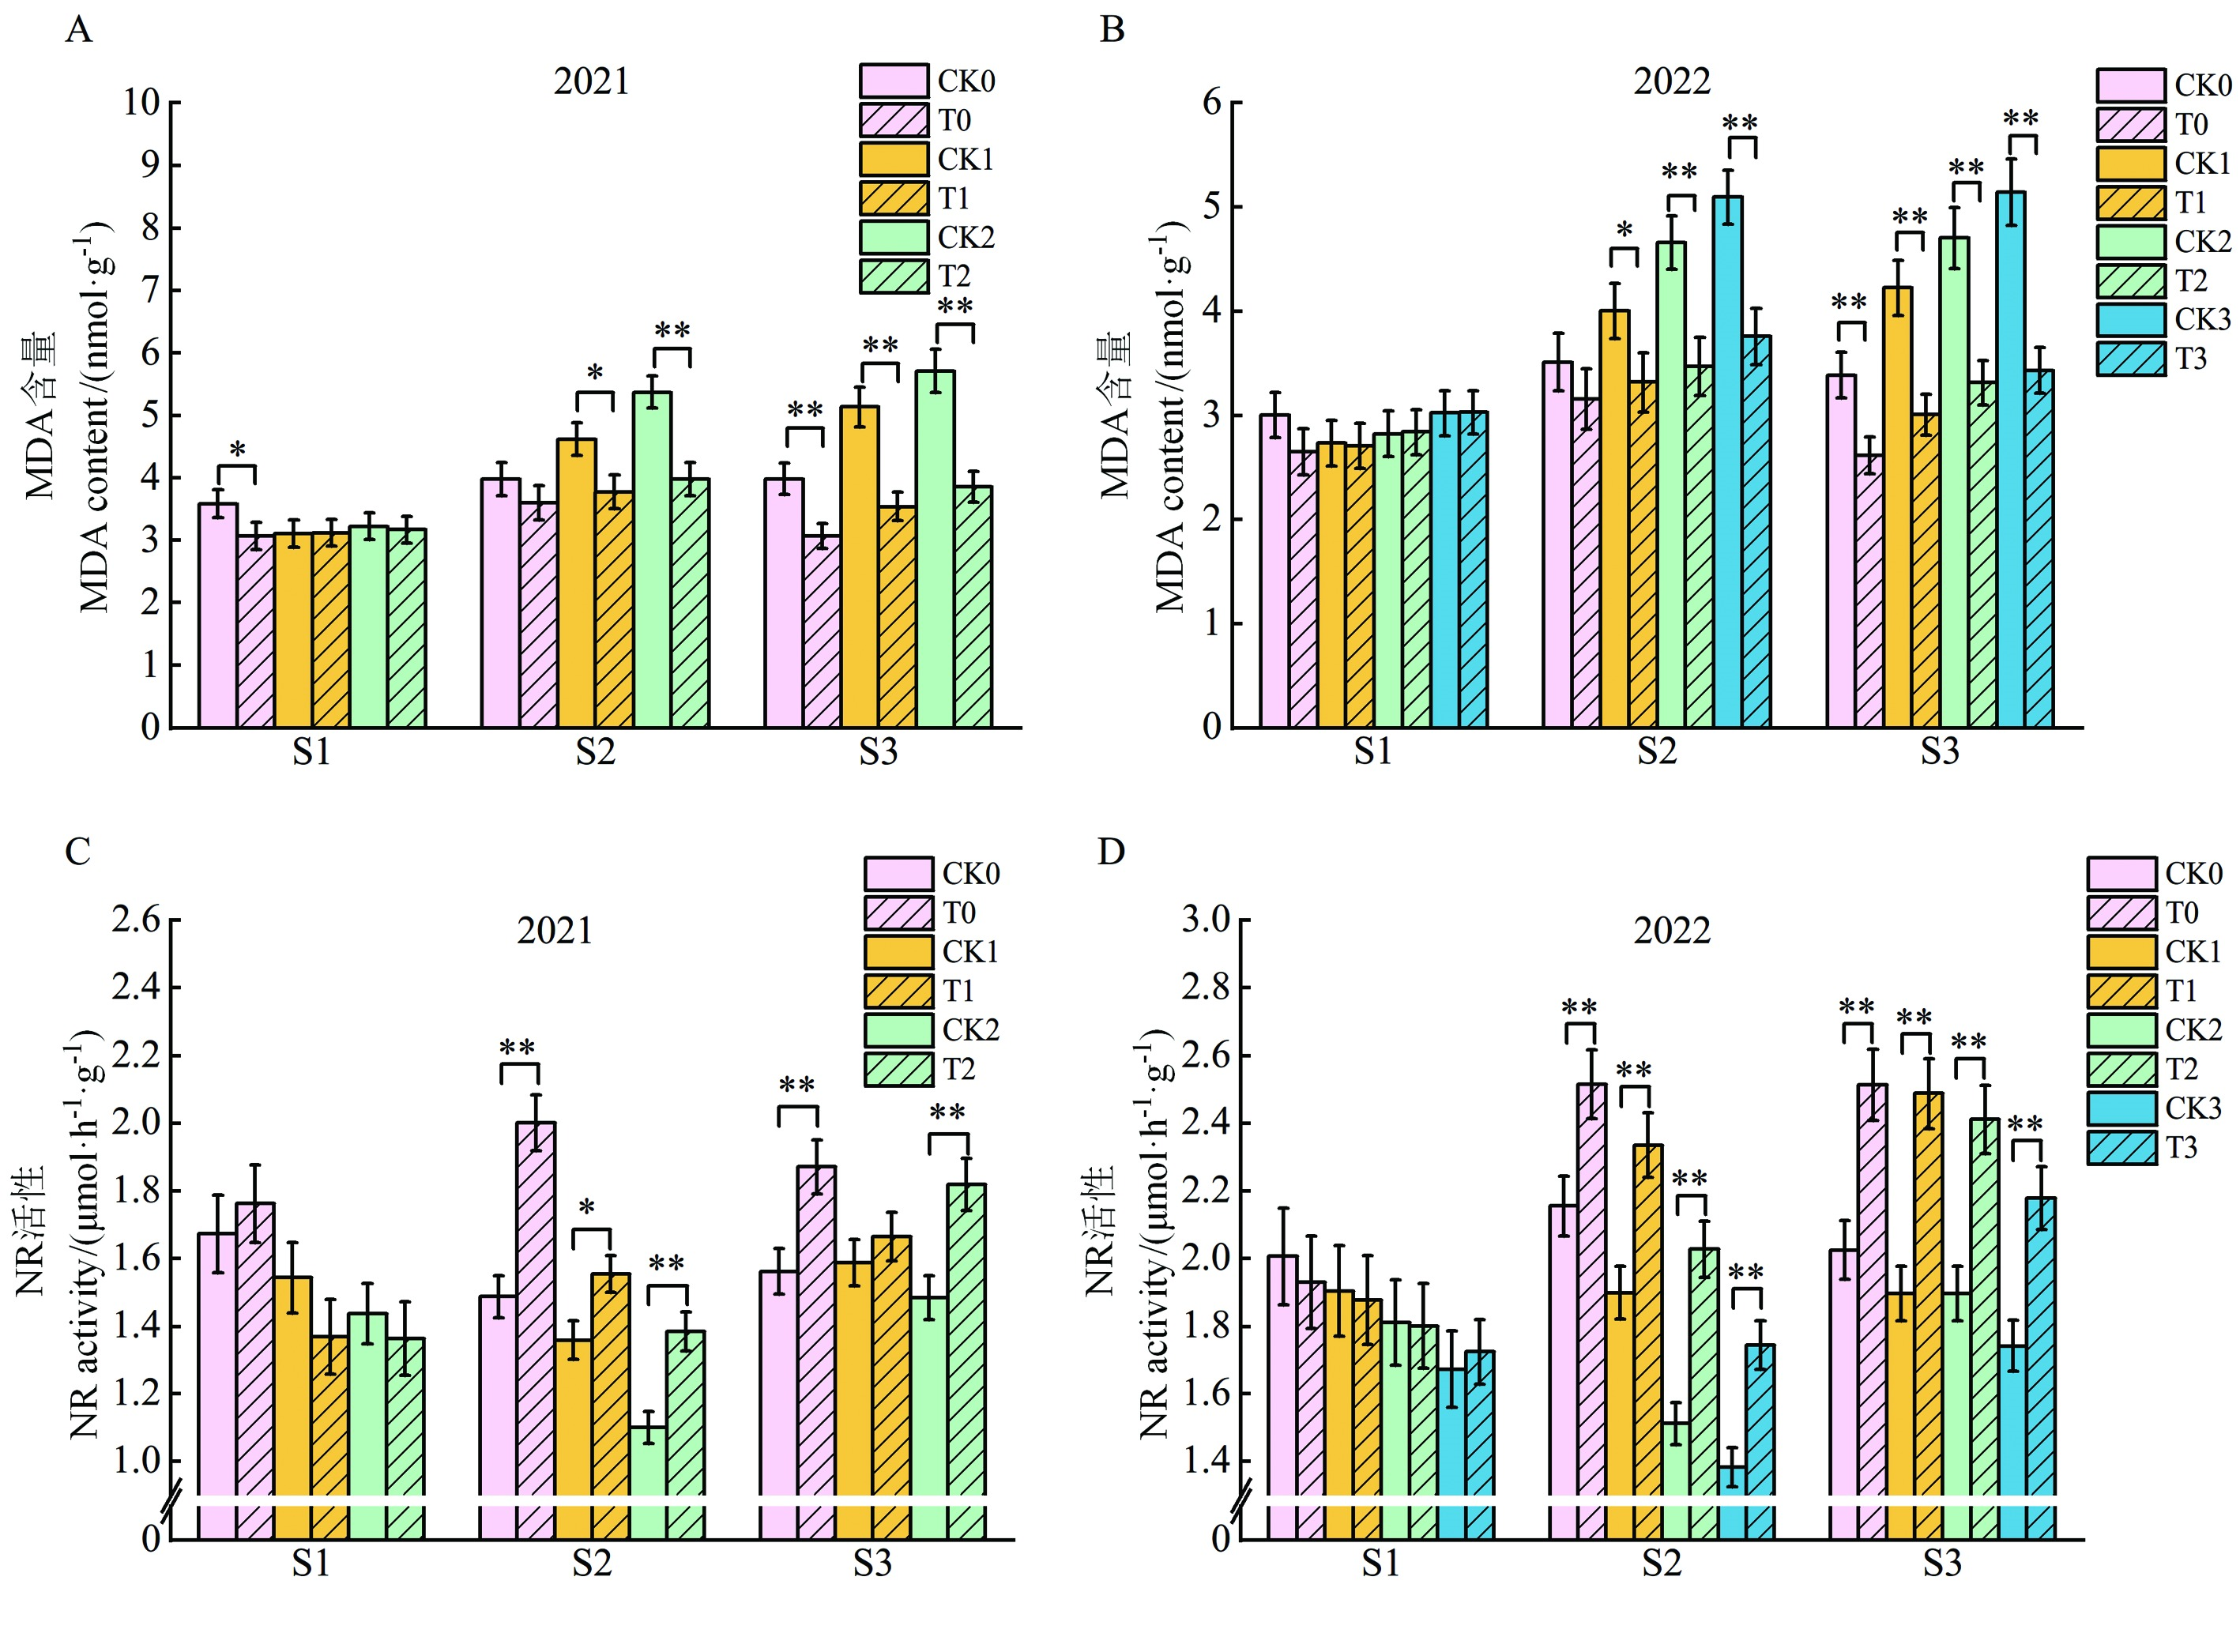
Fig. 2 Effects of N-life on MDA content and NR activity of cotton leaves at different developmental stagesS1, S2, and S3 represent the seedling stage, flowering and boll stage, and boll opening stage, respectively. * represents significant difference (P < 0.05); ** represents extremely significant difference (P < 0.01).
Other figure/table from this article