×
模态框(Modal)标题
在这里添加一些文本
Close
Close
Submit
Cancel
Confirm
×
模态框(Modal)标题
×
Journal
Article
Figure
Search
Sign In
Cotton Science
About journal
About journal
Editorial board
Indexed-in
Browse
Accepted
Current Issue
Archive
Most Download
Most Read
Most Cited
Browse by Column
Special Issue
Virtual Issue
Author Center
Submission
Guidelines
Manuscript Writing
Copyright Agreement
Template
Charges
Subscription
Contact us
中文
About journal
About journal
Editorial board
Indexed-in
Browse
Accepted
Current Issue
Archive
Most Download
Most Read
Most Cited
Browse by Column
Special Issue
Virtual Issues
Author Center
Submission
Guidelines
Manuscript Writing
Copyright Agreement
Template
Charges
Subscription
Contact us
中文
Figure/Table detail
Effects of N-life on the physiological characteristics, nitrogen use efficiency, lint yield, and fiber quality of cotton
MaXinyu, ZhuYueyi, ShiYiqi, ZhuShuijin, ZhaoTianlun
Cotton Science
, 2023, 35(
5
): 398-411. DOI:
10.11963/cs20230029
处理
Treatment
尿素用量
Urea application level/(g·pot
-1
)
N-life用量
N-life application level/(g·pot
-1
)
TNC
6.0
0.1
CKC
6.1
0.0
TN
0.0
0.1
CK
0.1
0.0
Table 3
Treatments of the pot experiment in greenhouse
Other figure/table from this article
Table 1
The original soil-fertility in the experimental field
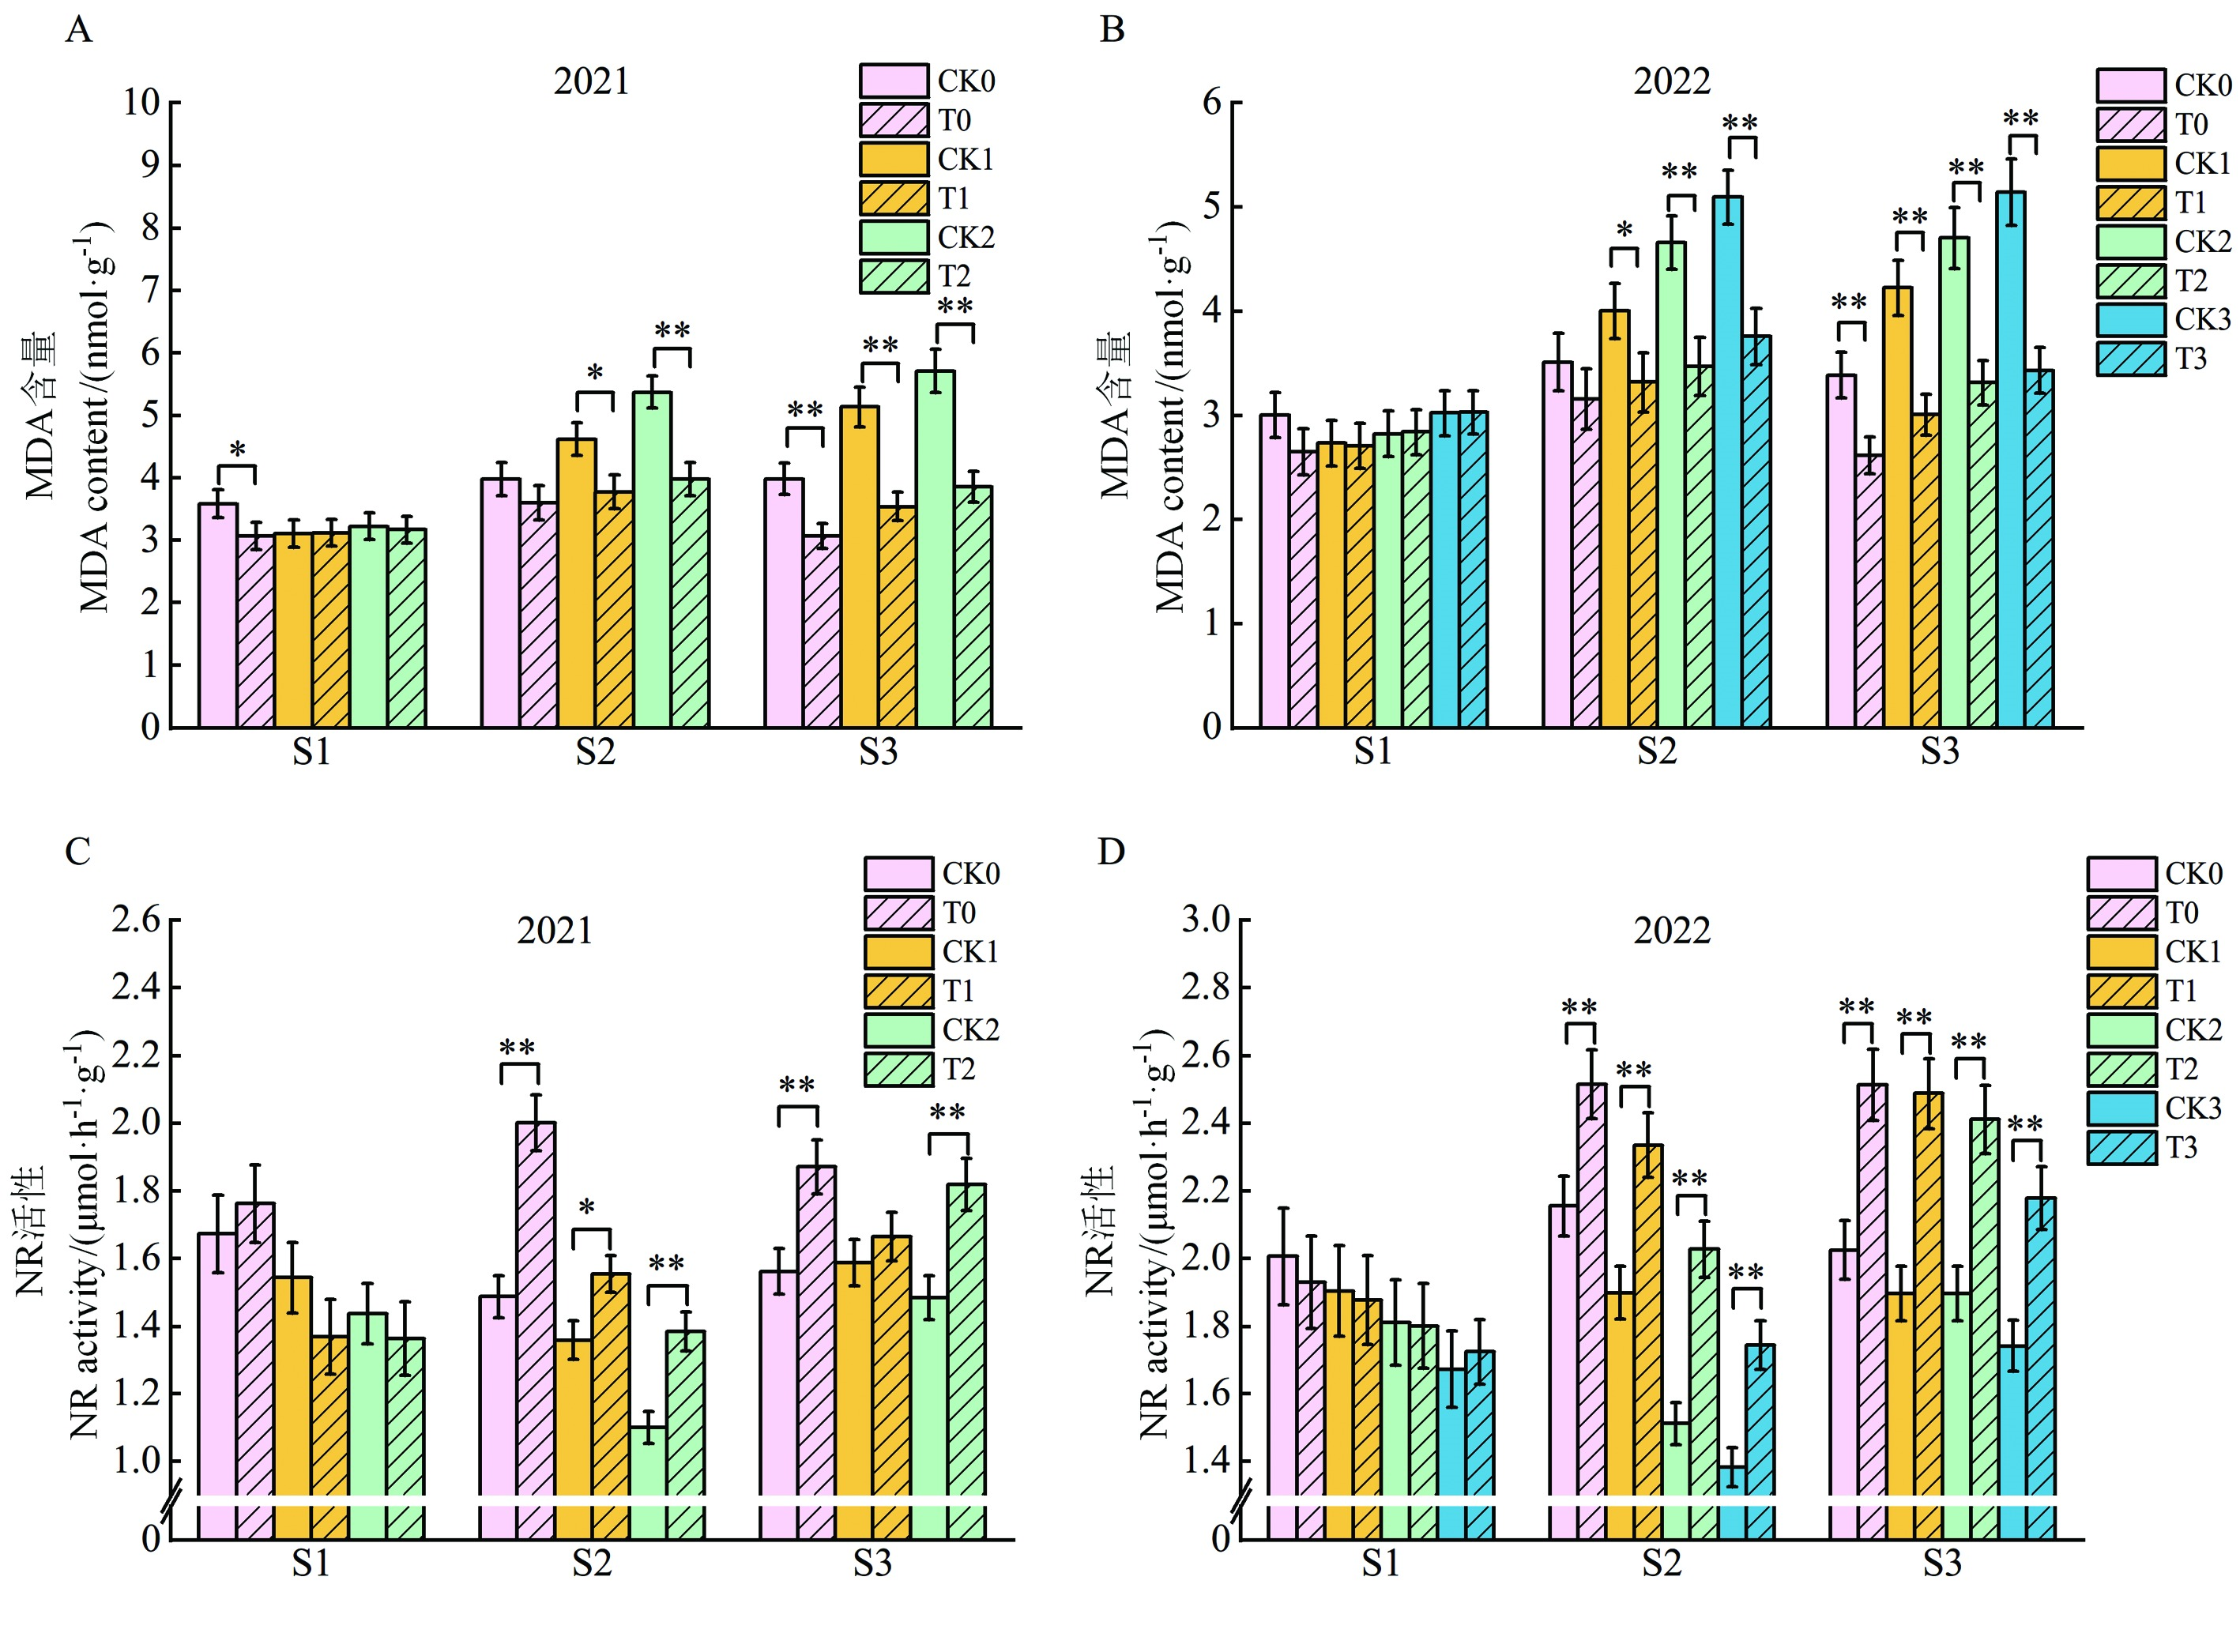
Fig. 2
Effects of N-life on MDA content and NR activity of cotton leaves at different developmental stages
S1, S2, and S3 represent the seedling stage, flowering and boll stage, and boll opening stage, respectively. * represents significant difference (
P
< 0.05); ** represents extremely significant difference (
P
< 0.01).
Table 4
Effects of N-life on photosynthetic indicators of cotton leaves at different growth stages
Table 5
Effects of N-life on the nitrogen use efficiency of cotton
Table 6
Effects of N-life on cotton agronomic traits
Table 8
Effects of N-life on cotton fiber quality index
Table 7
Effects of N-life on cotton yield traits
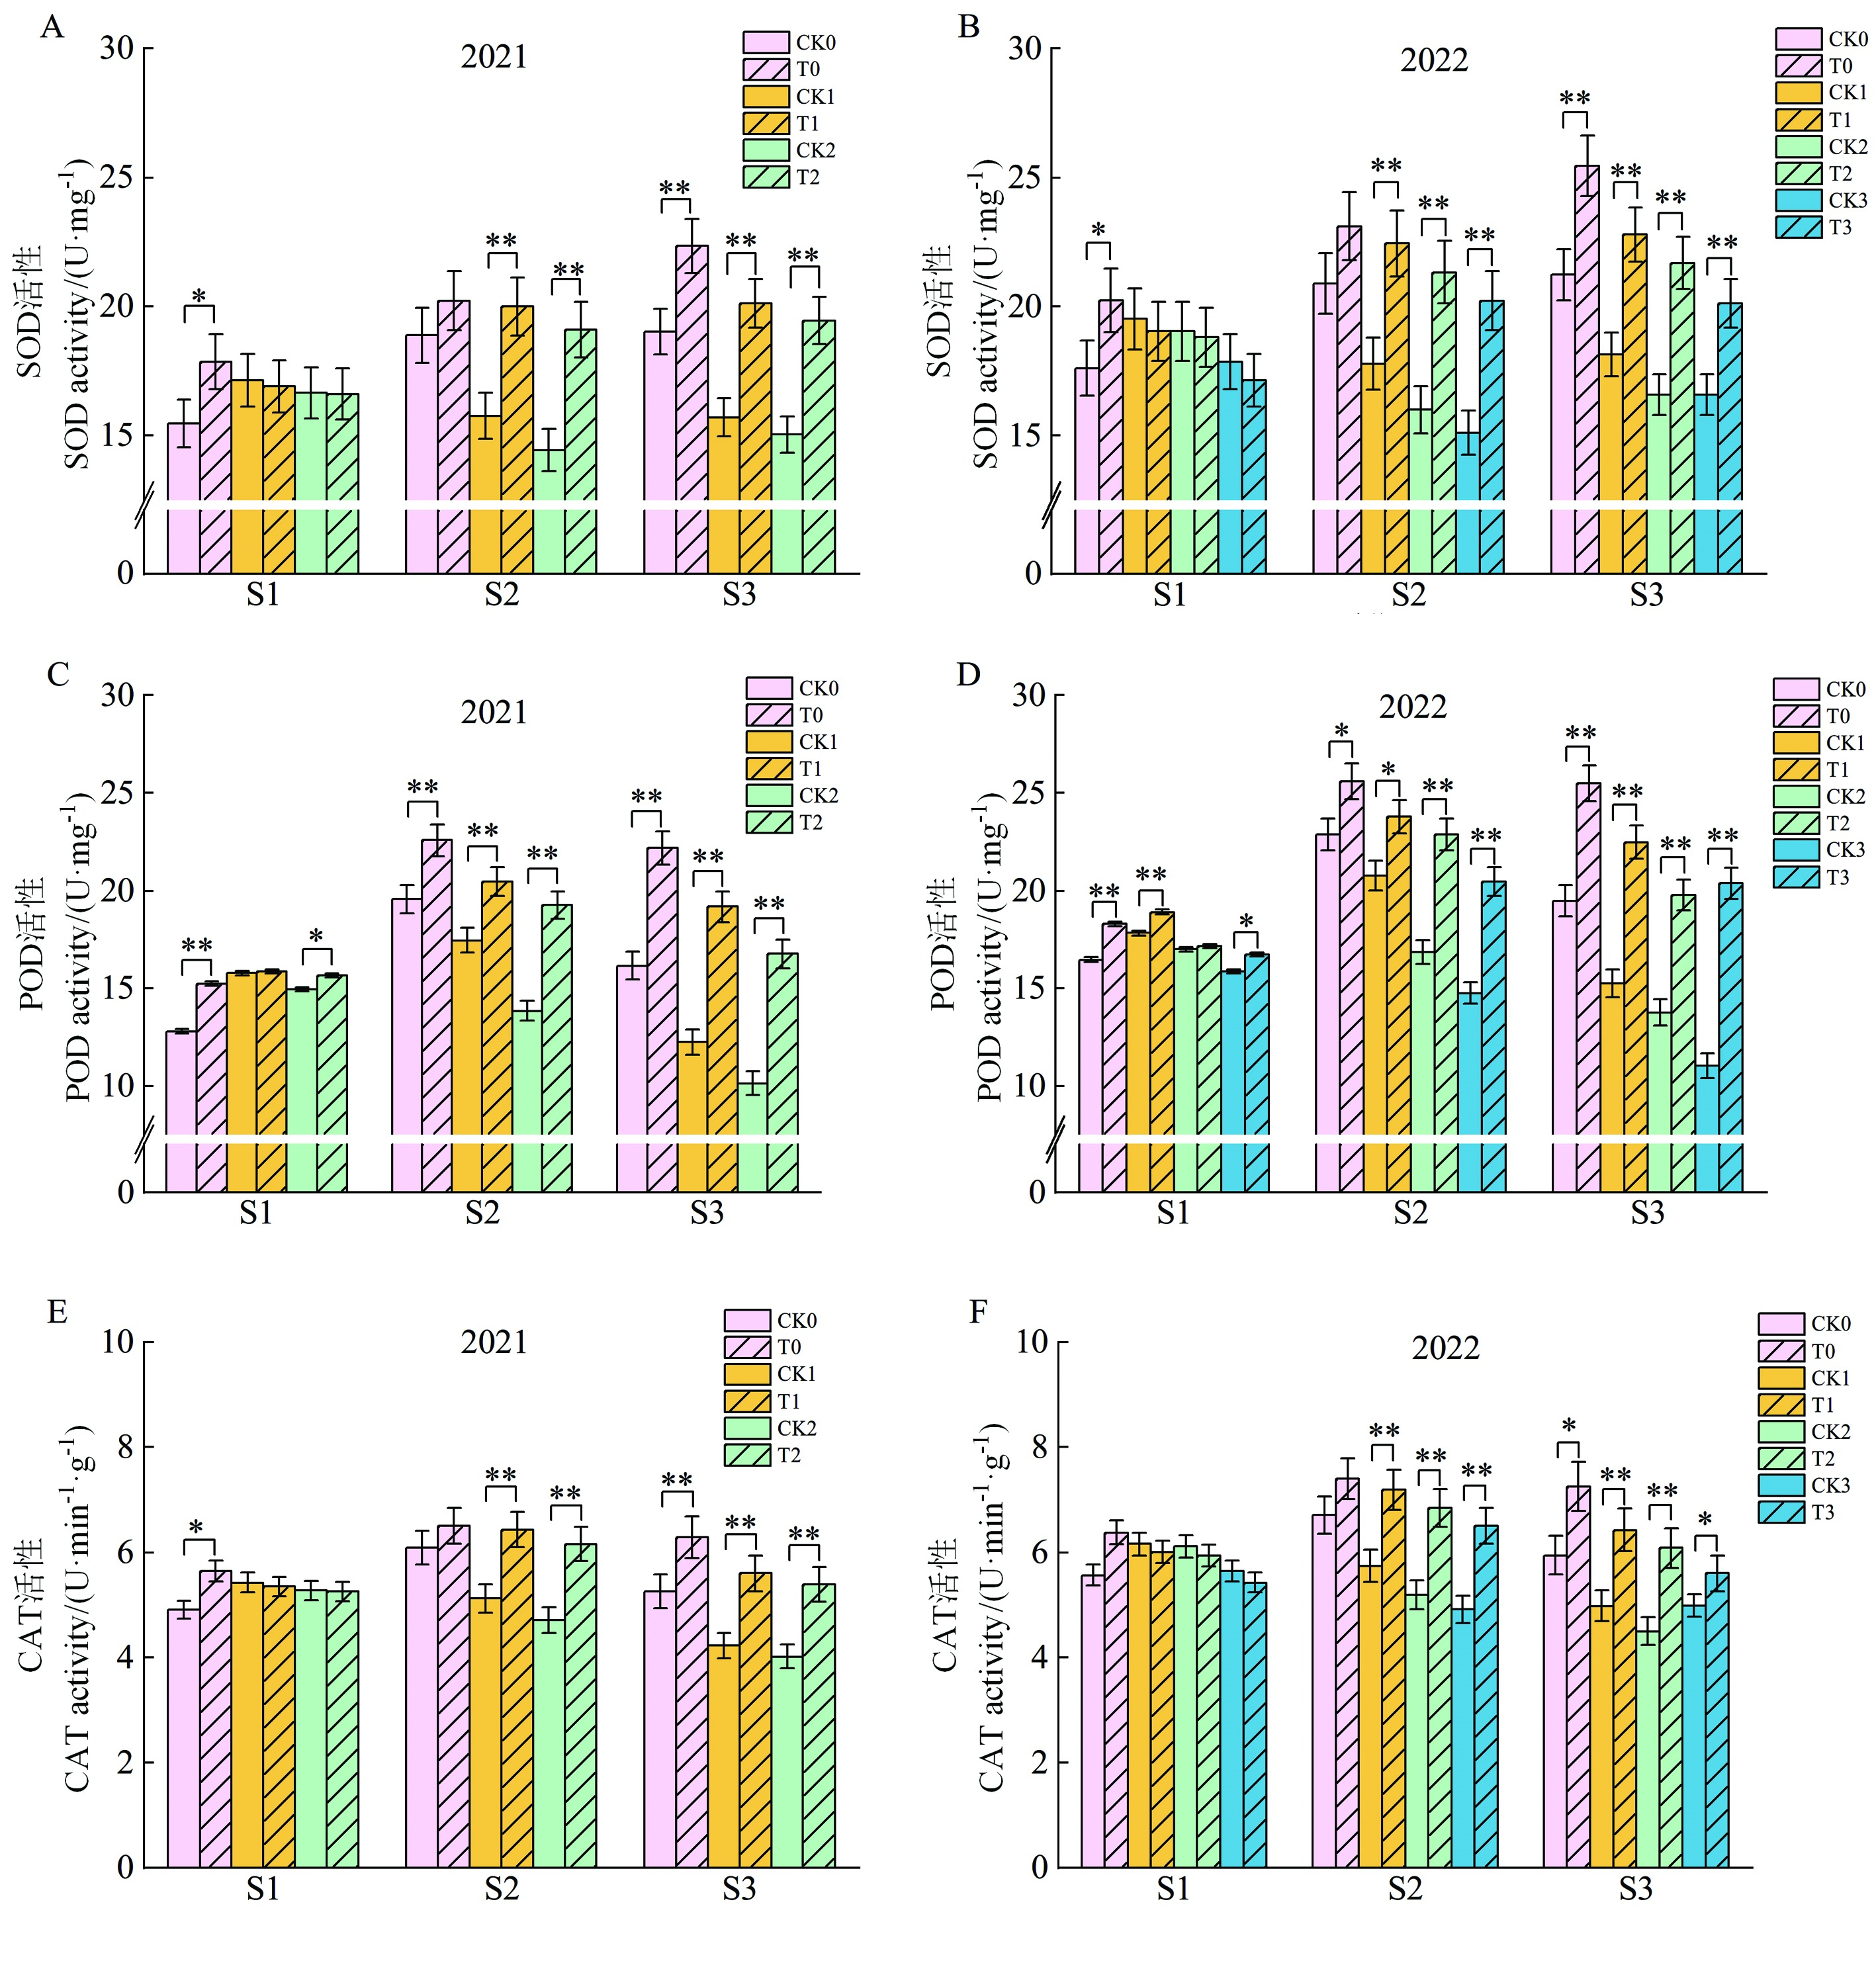
Fig. 1
Effects of N-life on SOD, POD, and CAT activity of cotton leaves at different developmental stages
S1, S2, and S3 represent the seedling stage, flowering and boll stage, and boll opening stage, respectively. * represents significant difference (
P
< 0.05); ** represents extremely significant difference (
P
< 0.01).
Table 2
Application levels of nitrogen and N-life in different treatments