×
模态框(Modal)标题
在这里添加一些文本
Close
Close
Submit
Cancel
Confirm
×
模态框(Modal)标题
×
Journal
Article
Figure
Search
Sign In
Scientia Agricultura Sinica
About journal
About journal
Editorial board
Indexed-in
Browse
Accepted
Current Issue
Archive
Most Download
Most Read
Most Cited
Browse by Column
Special Issue
Virtual Issue
Author Center
Submission
Guidelines
Manuscript Writing
Copyright Agreement
Template
Charges
Subscription
Contact us
中文
About journal
About journal
Editorial board
Indexed-in
Browse
Accepted
Current Issue
Archive
Most Download
Most Read
Most Cited
Browse by Column
Special Issue
Virtual Issues
Author Center
Submission
Guidelines
Manuscript Writing
Copyright Agreement
Template
Charges
Subscription
Contact us
中文
Figure/Table detail
Variation in Rice Yield Response to Fertilization in China: Meta-analysis
HAN TianFu, MA ChangBao, HUANG Jing, LIU KaiLou, XUE YanDong, LI DongChu, LIU LiSheng, ZHANG Lu, LIU ShuJun, ZHANG HuiMin
Scientia Agricultura Sinica
, 2019, 52(
11
): 1918-1929. DOI:
10.3864/j.issn.0578-1752.2019.11.007
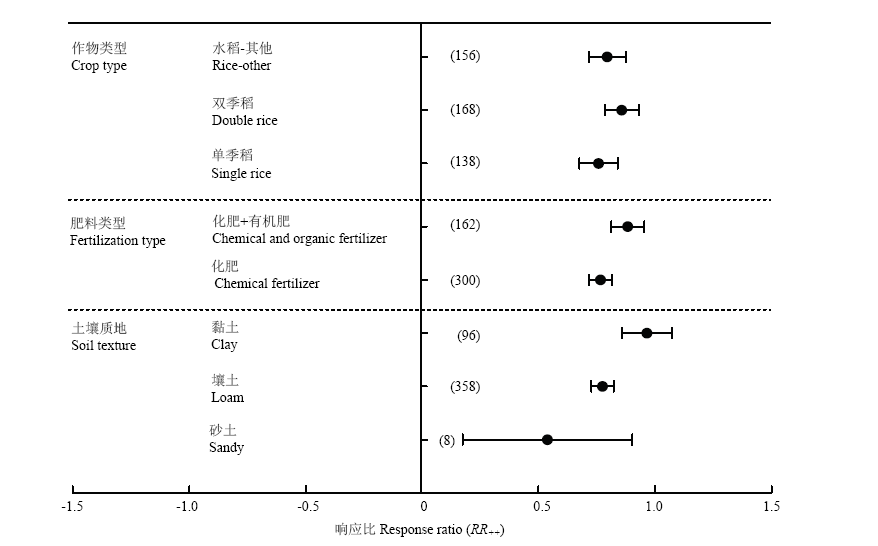
Fig. 3
Response ratio (
RR
++
) of rice yield in response to fertilization practices in different crops, fertilizers, and soil textures
Other figure/table from this article
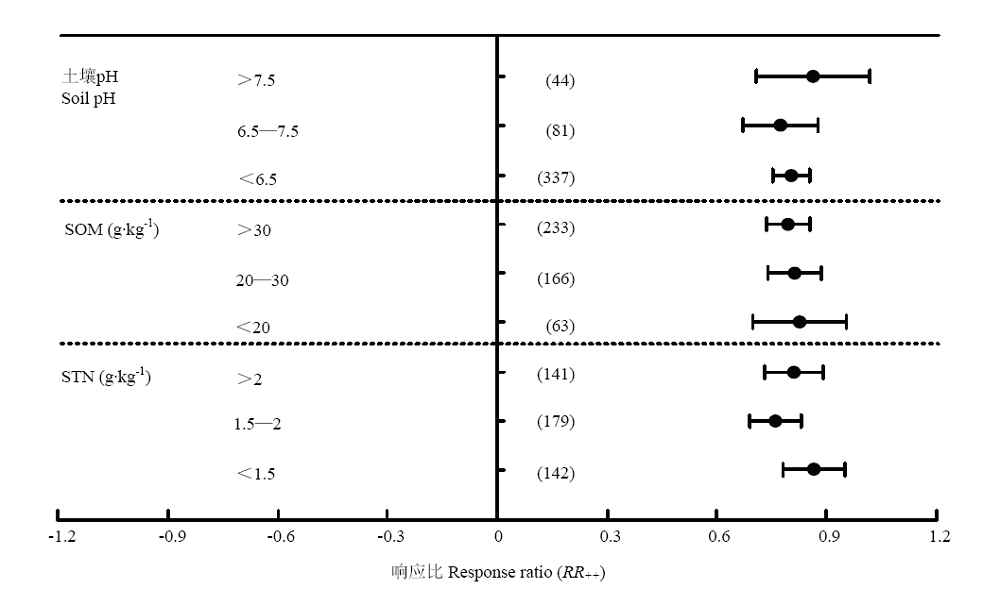
Fig. 4
Response ratio (
RR
++
) of rice yield in response to fertilization practices in different the soil pH, organic matter, and total nitrogen levels
SOM: Soil organic matter; STN: Soil total nitrogen. The same as below
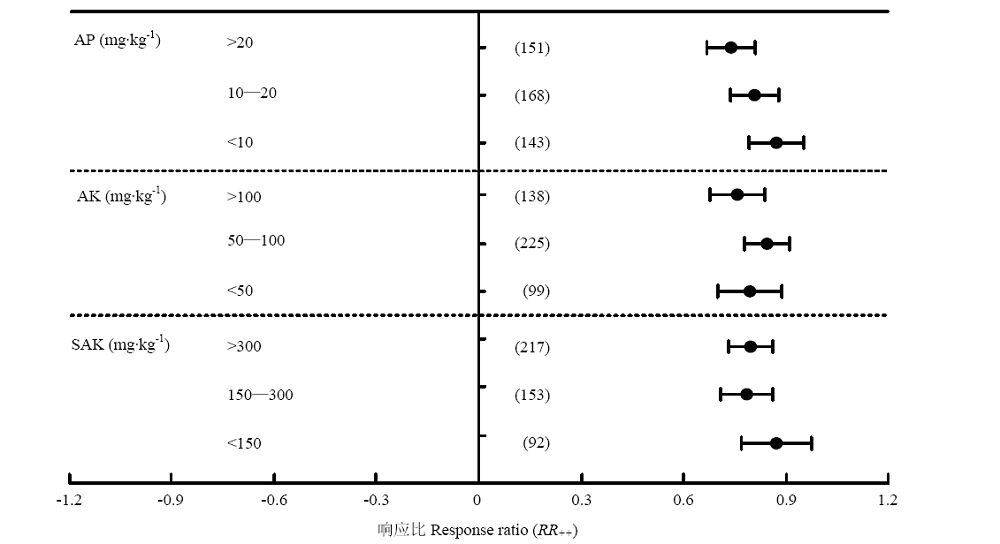
Fig. 5
Response ratio (
RR
++
) of rice yield in response to fertilization practices in different the soil available phosphorus, available potassium and slowly available potassium levels
AP: Soil available phosphorus; AK: Soil available potassium; SAK: Soil slowly available potassium. The same as below
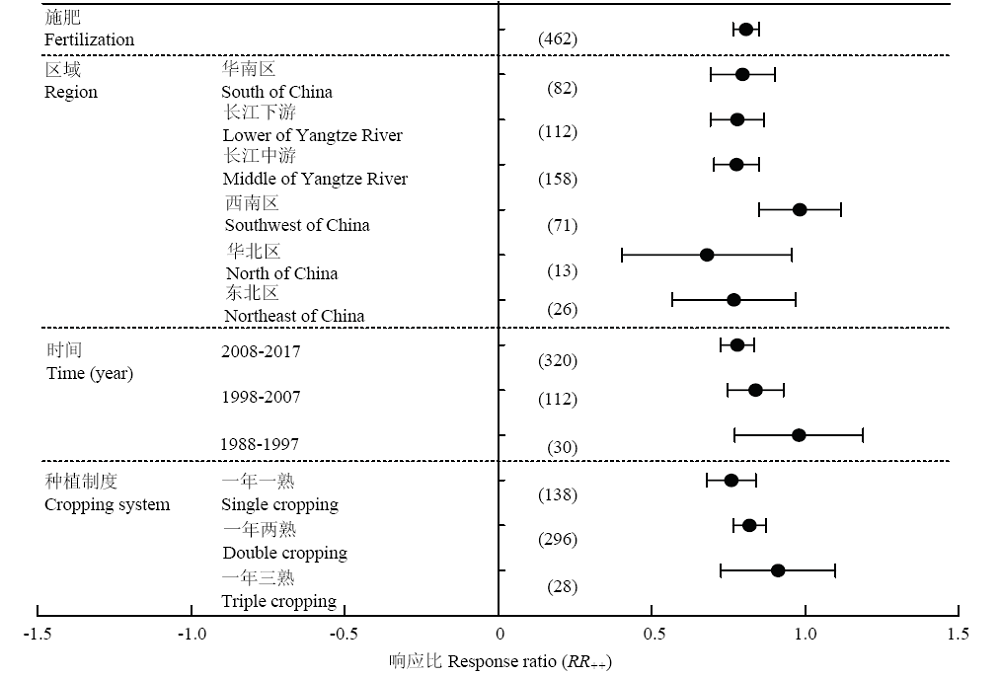
Fig. 2
Response ratio (
RR
++
) of rice yield in response to fertilization practices in different regions, times, and cropping systems
Dots with error bars denote the overall mean response ratio and 95% CI, respectively. The 95% CI that do not go across the zero line mean significant difference between treatment and control. The values in parentheses represent independent sample size. The same as below
Table 1
Descriptive statistics for sample size
Fig. 7
Relationship between the response ratio (
RR
++
) of rice yield and fertilizer agricultural efficiency
CF: Chemical fertilizer; CMF: Chemical and organic fertilizer
Fig. 6
Variable importance
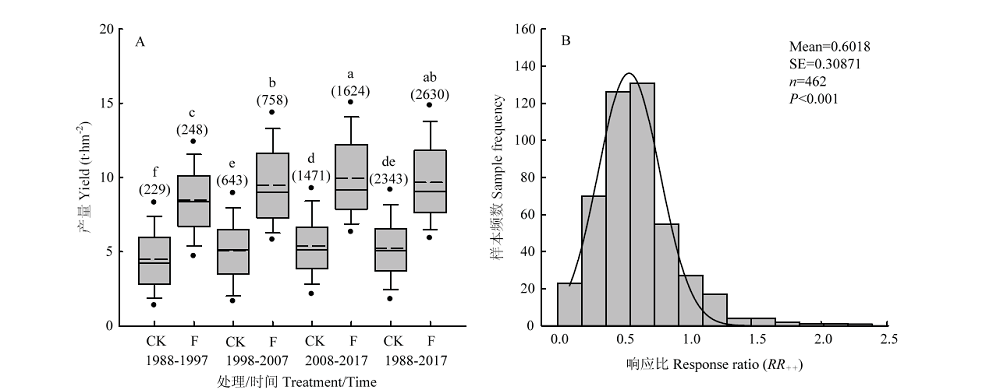
Fig. 1
The yield of rice under different treatments
CK means no fertilizer treatment, F means conventional fertilizer treatment. Different lowercases indicate significantly different (
P
<0.05); The solid line in the box represents the median value, and dash line represents the average value. The upper and lower of the box represent 75% and 25% of total data, respectively. The upper and lower of the lines represent 95% and 5% of total data, respectively. The upper and lower of the solid points represent the vertical outliers. The values in parentheses represent the number of rice yield data of each treatment