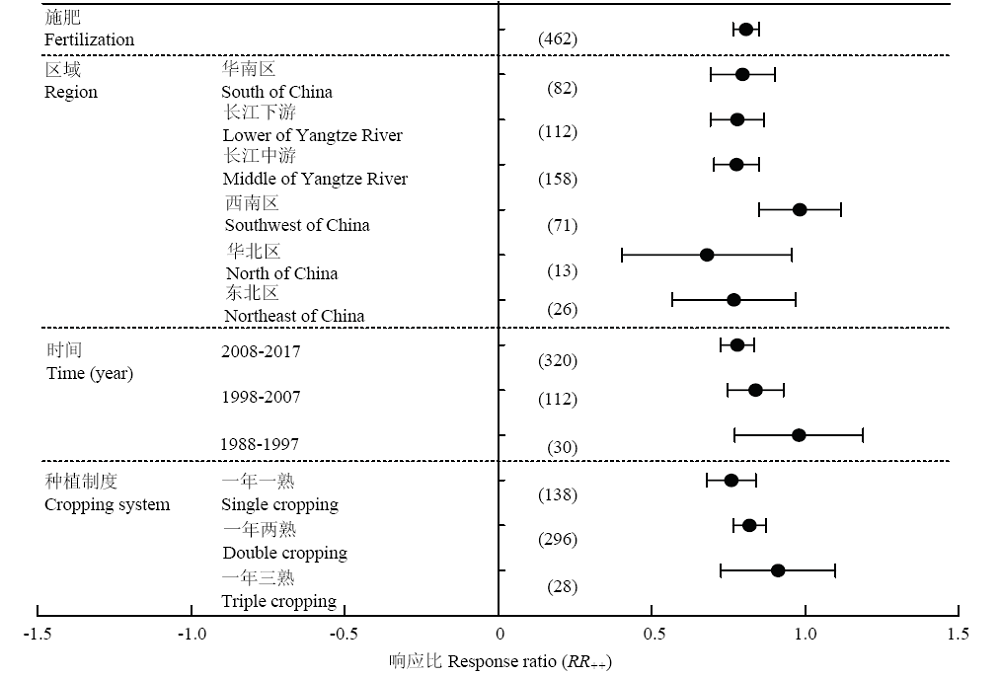
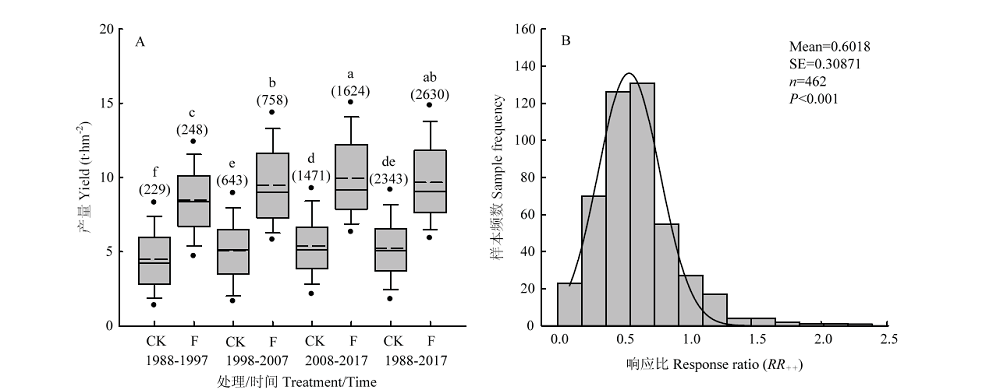
Fig. 2 Response ratio (RR++) of rice yield in response to fertilization practices in different regions, times, and cropping systems
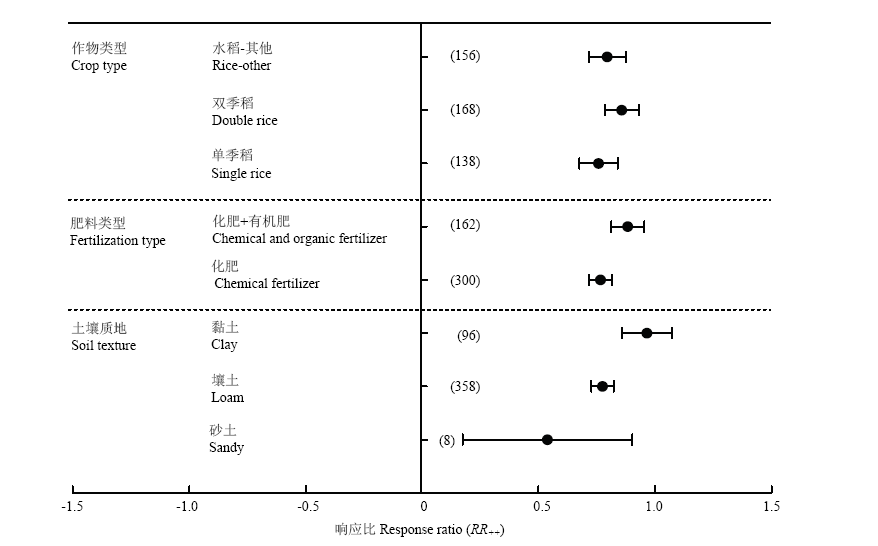
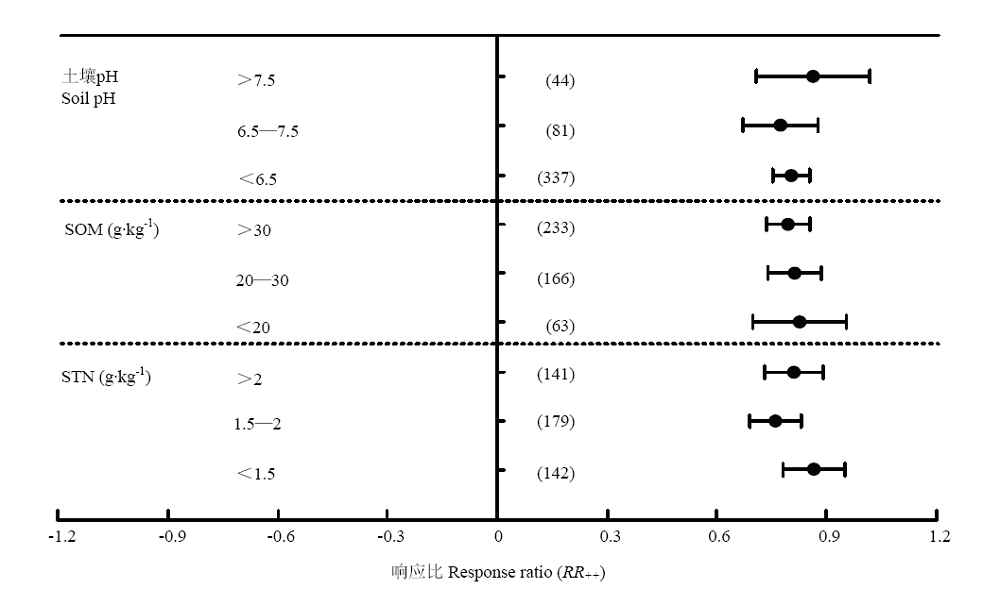
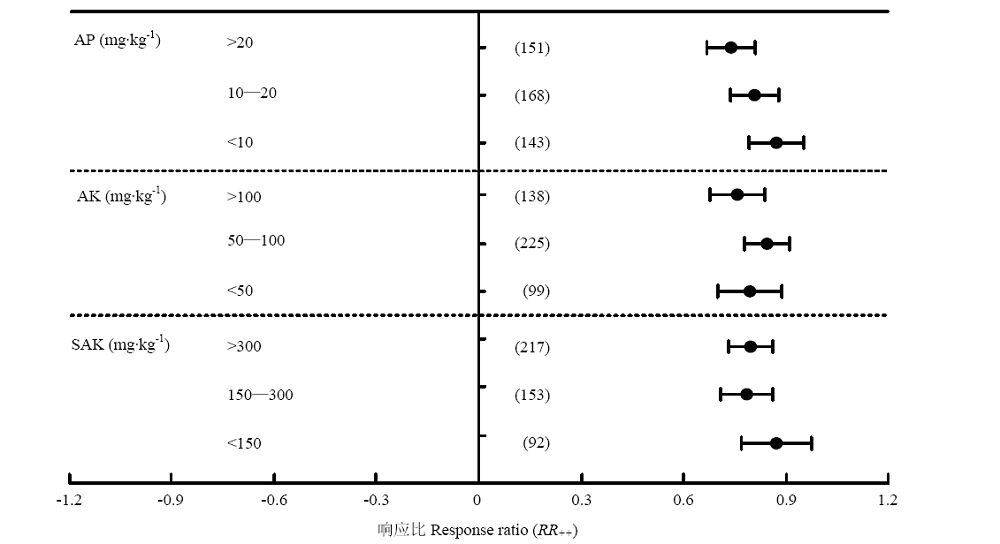
Dots with error bars denote the overall mean response ratio and 95% CI, respectively. The 95% CI that do not go across the zero line mean significant difference between treatment and control. The values in parentheses represent independent sample size. The same as below
Other figure/table from this article