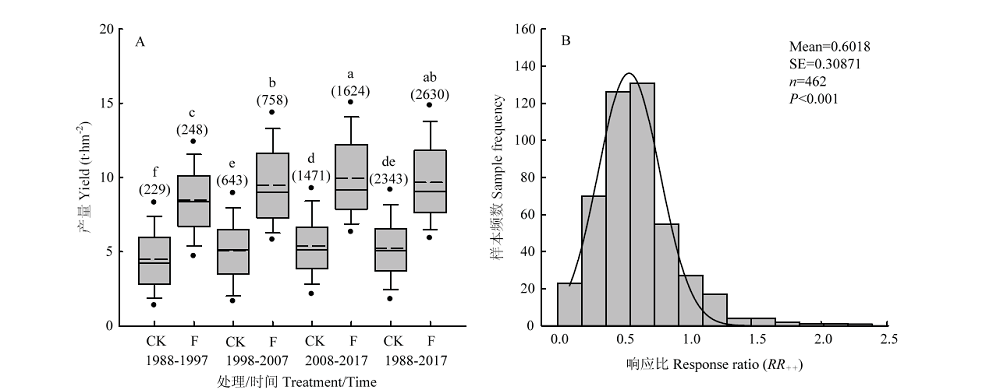
Fig. 1 The yield of rice under different treatments
CK means no fertilizer treatment, F means conventional fertilizer treatment. Different lowercases indicate significantly different (P<0.05); The solid line in the box represents the median value, and dash line represents the average value. The upper and lower of the box represent 75% and 25% of total data, respectively. The upper and lower of the lines represent 95% and 5% of total data, respectively. The upper and lower of the solid points represent the vertical outliers. The values in parentheses represent the number of rice yield data of each treatment
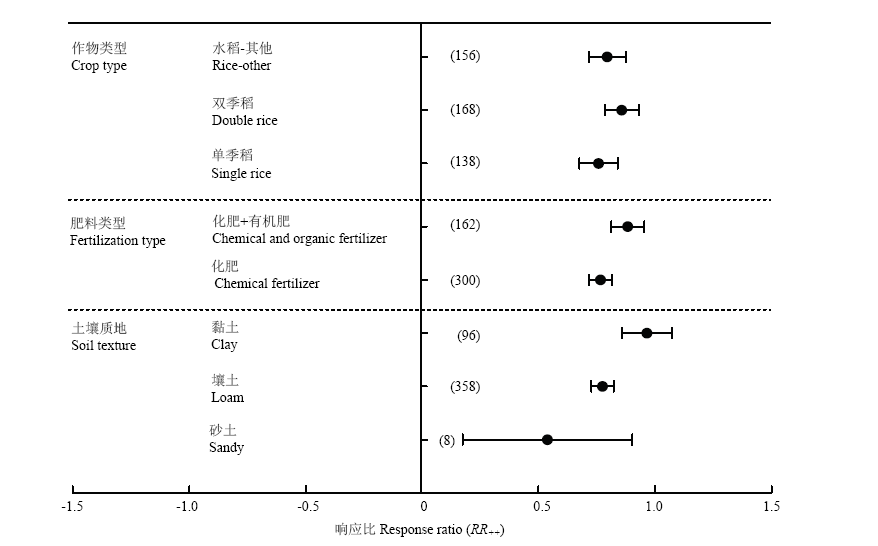
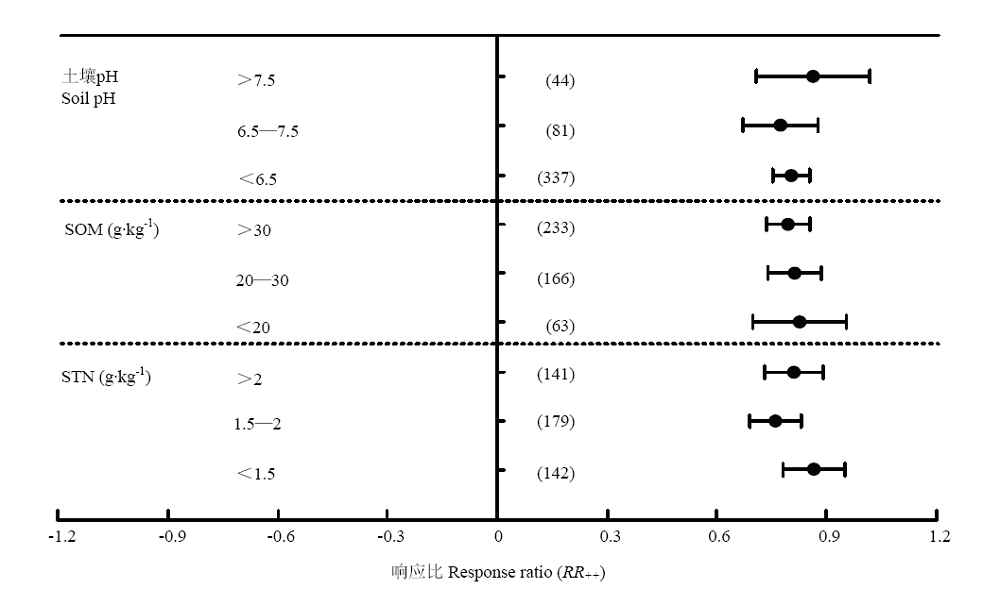
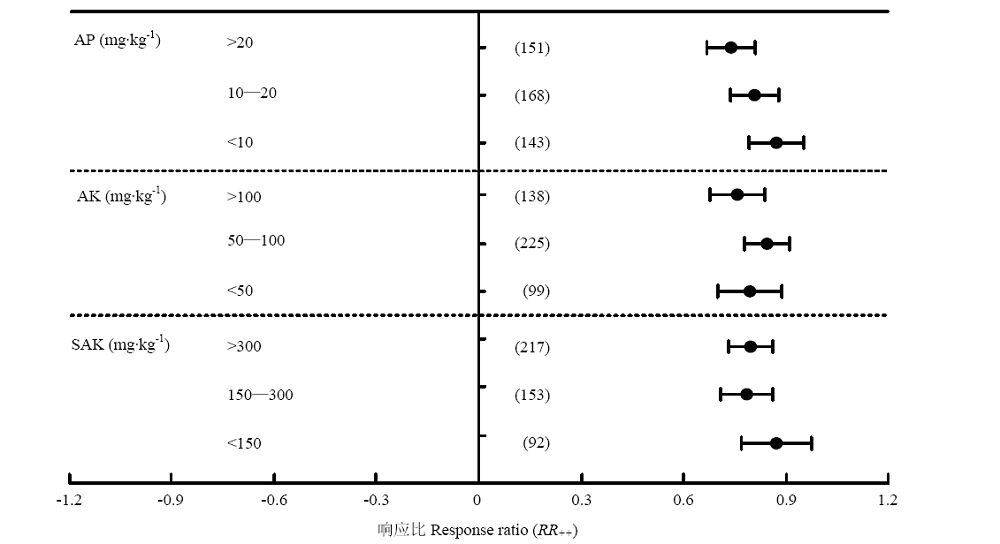
Other figure/table from this article