×
模态框(Modal)标题
在这里添加一些文本
Close
Close
Submit
Cancel
Confirm
×
模态框(Modal)标题
×
Journal
Article
Figure
Search
Sign In
Scientia Agricultura Sinica
About journal
About journal
Editorial board
Indexed-in
Browse
Accepted
Current Issue
Archive
Most Download
Most Read
Most Cited
Browse by Column
Special Issue
Virtual Issue
Author Center
Submission
Guidelines
Manuscript Writing
Copyright Agreement
Template
Charges
Subscription
Contact us
中文
About journal
About journal
Editorial board
Indexed-in
Browse
Accepted
Current Issue
Archive
Most Download
Most Read
Most Cited
Browse by Column
Special Issue
Virtual Issues
Author Center
Submission
Guidelines
Manuscript Writing
Copyright Agreement
Template
Charges
Subscription
Contact us
中文
Figure/Table detail
Quantitative Analysis of Driving-Factors of Soil Acidification in Qiyang County, Hunan Province
ZHOU HaiYan,XU MingGang,CAI ZeJiang,WEN ShiLin,WU HongHui
Scientia Agricultura Sinica
, 2019, 52(
8
): 1400-1412. DOI:
10.3864/j.issn.0578-1752.2019.08.010
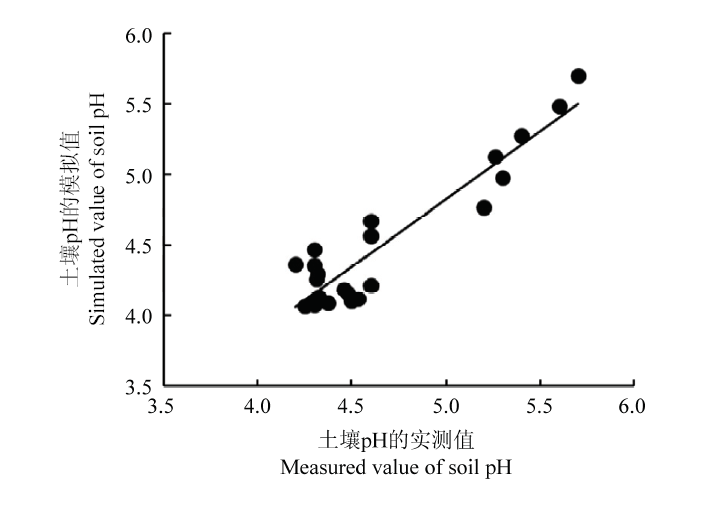
Fig. 2
Comparison of simulated value and measured value of soil pH
Other figure/table from this article
Table 10
Soil buffer capacity and H
+
net production of wheat-corn long-term experiment in Qiyang County
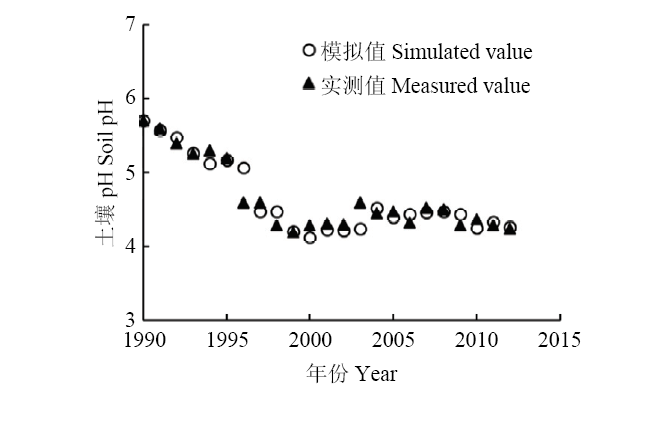
Fig. 1
The changes of simulated value and measured value of soil pH in different years
Table 5
Wood biomass, element contents in stem, branches and fruits for typical economic forests
Table 1
Element input of main crops and orange
Table 3
Input-output fluxes of N in typical agricultural systems
Table 2
Grain dry matter yield and element contents in seeds and straws for typical crops
Table 4
Wood biomass, element contents in stem wood and branches for typical timber forests
Table 6
Grain dry matter yield and element contents for long term experiment of wheat-corn
Table 7
H
+
production of acidity-inducing factors among the different land use patterns
Table 8
H
+
production of acidity-inducing factors among the six main crop systems
Table 9
H
+
production of acidity-inducing factors among the seven main woodland systems