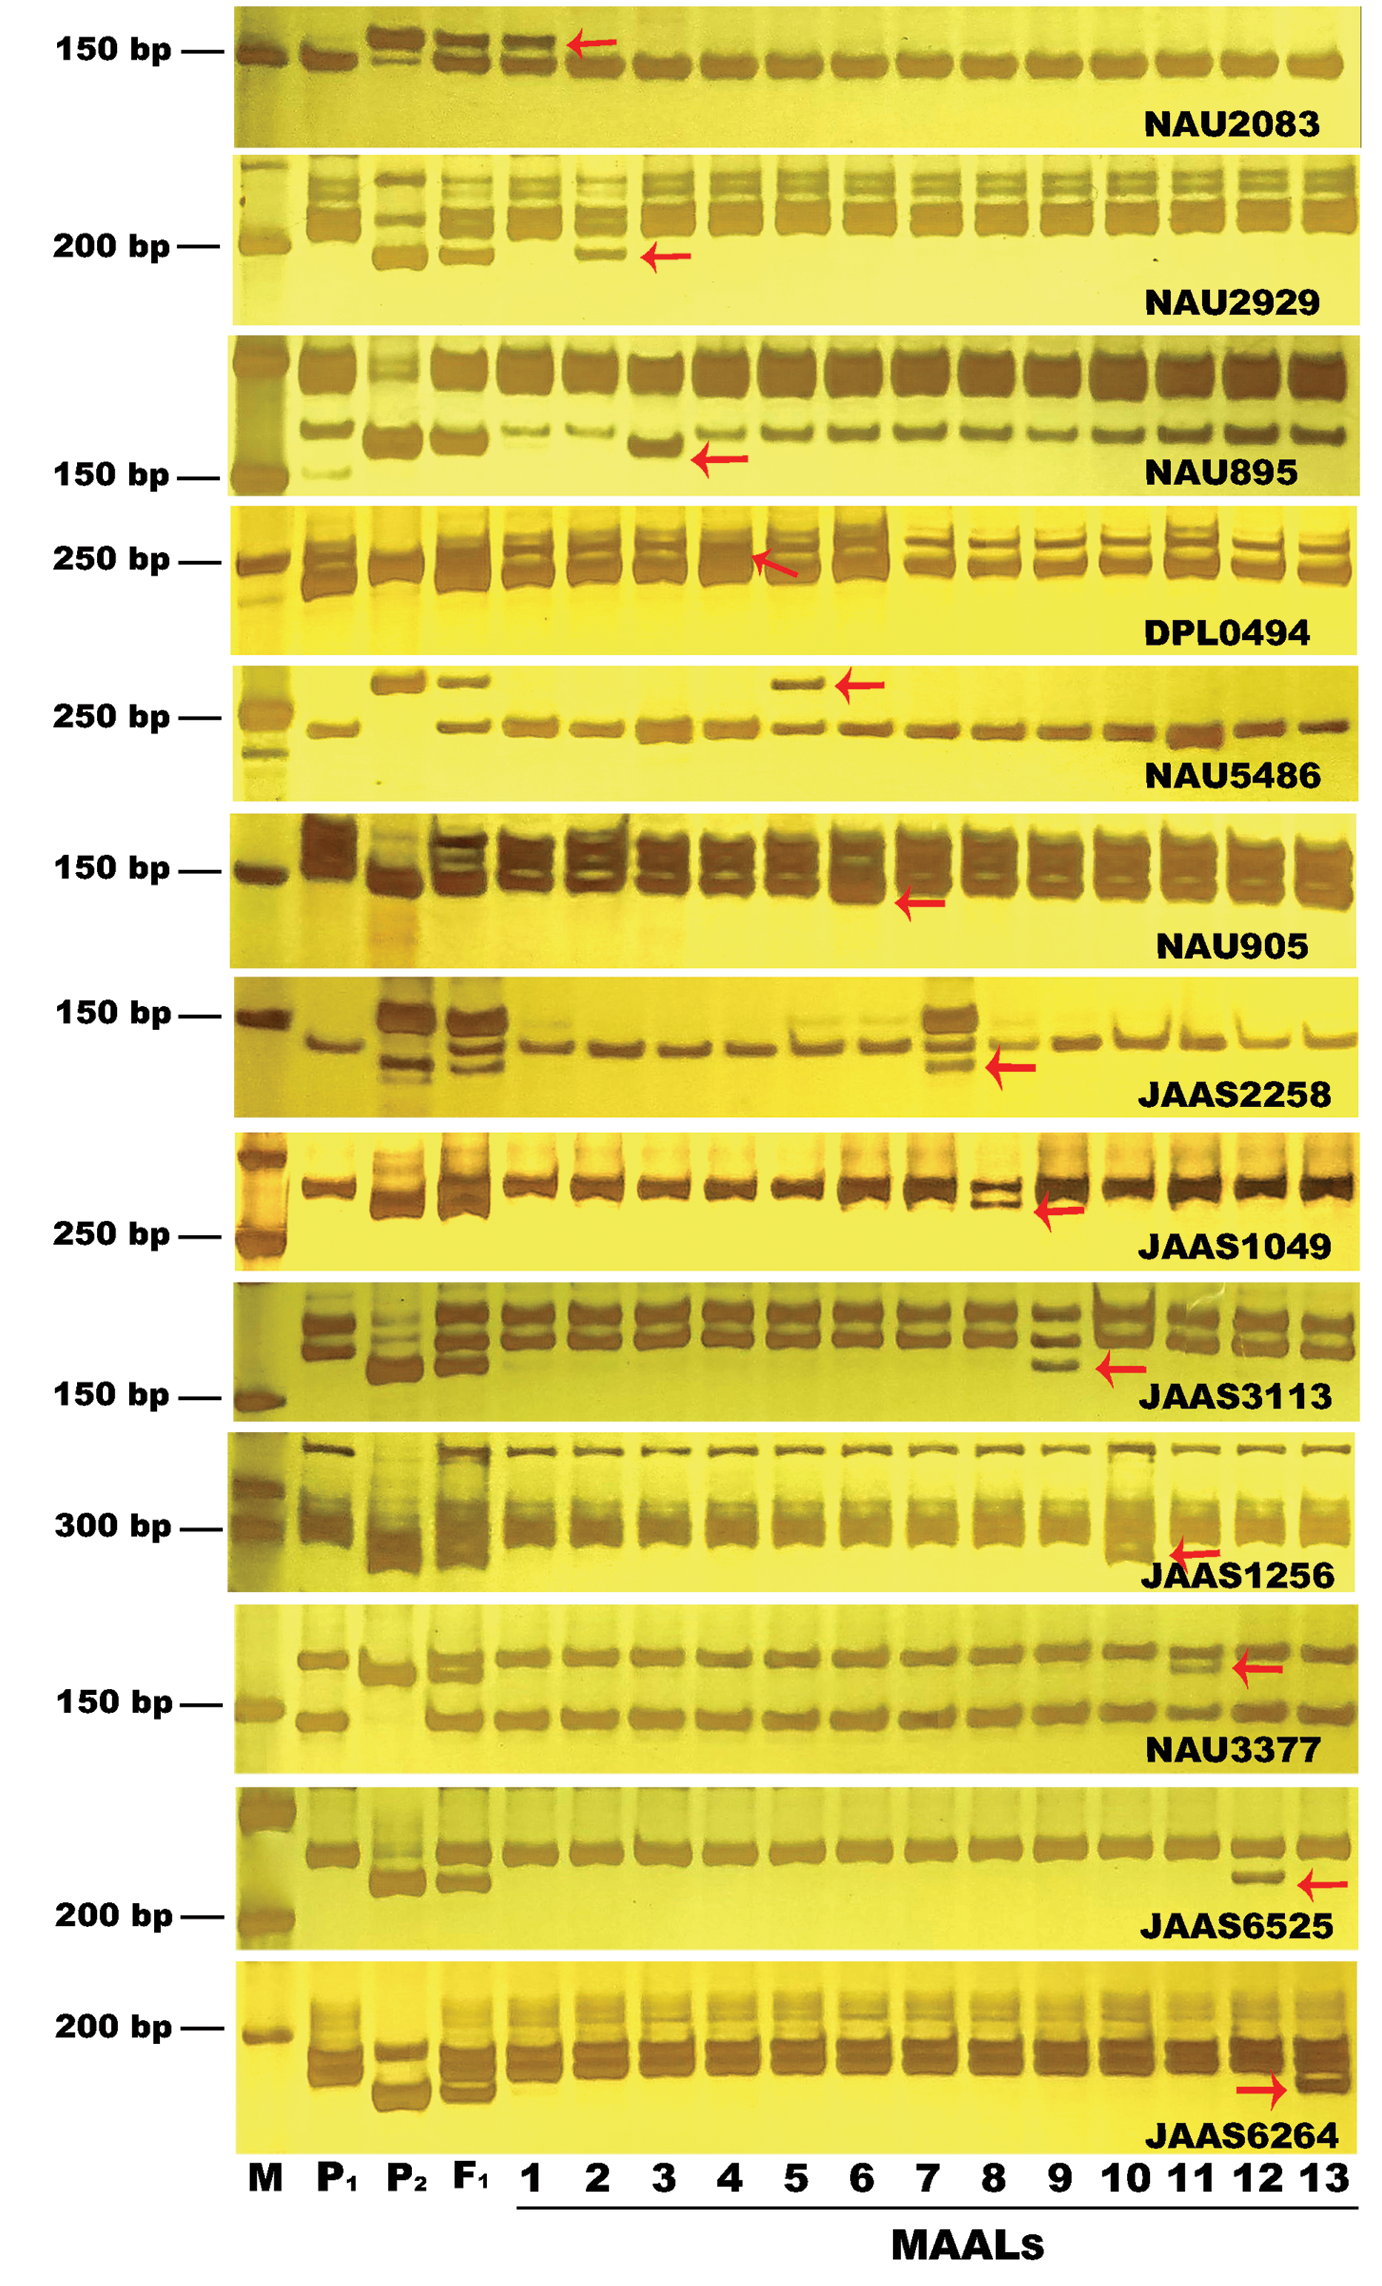
Fig. 1 Amplification patterns of a set of MAALs derived from G. anomalum in G. hirsutum background using G. anomalum-specific SSR markers M, P1, P2, and F1 represent 50 bp DNA Ladder Marker, Su8289, G. anomalum, and the hexaploid from G. hirsutum× G. anomalum, respectively. The 1-13 lanes show that each MAAL possesses a single chromosome from G. anomalum. Red arrows represent specific bands of G. anomalum. SSR markers are presented on the bottom right of each panel.
Other figure/table from this article